Delivering Data Happiness

Recently, a happiness meme has been making its way around the data quality blogosphere.

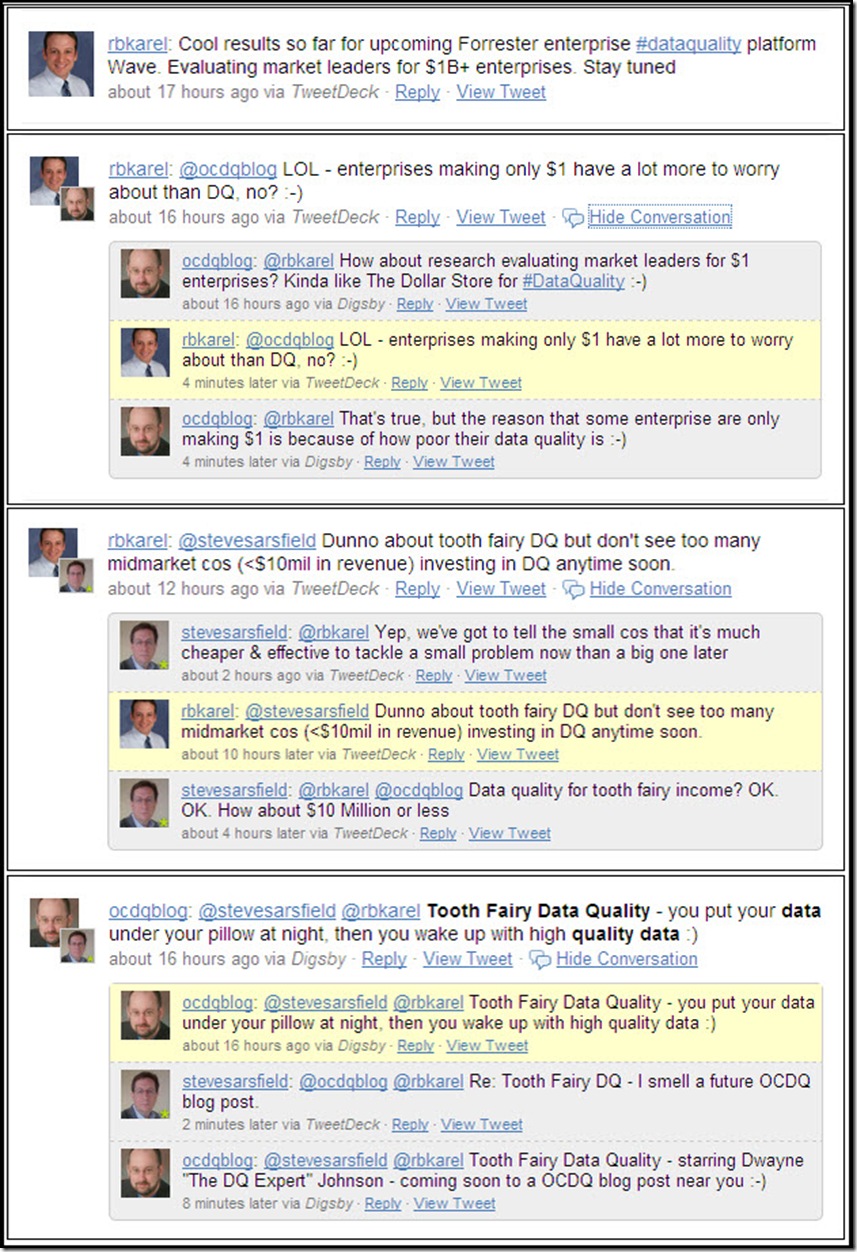
Its origins have been traced to a lovely day in Denmark when Henrik Liliendahl Sørensen, with help from The Muppet Show, asked “Why do you watch it?” referring to the typically negative spin in the data quality blogosphere, where it seems we are:

“Always describing how bad data is everywhere.

Bashing executives who don’t get it.

Telling about all the hard obstacles ahead. Explaining you don’t have to boil the ocean but might get success by settling for warming up a nice little drop of water.

Despite really wanting to tell a lot of success stories, being the funny Fozzie Bear on the stage, well, I am afraid I also have been spending most of my time on the balcony with Statler and Waldorf.

So, from this day forward: More success stories.”

In his recent blog posts, The Ugly Duckling and Data Quality Tools: The Cygnets in Information Quality, Henrik has been sharing more success stories, or to phrase it in an even happier way: delivering data happiness.


Delivering Data Happiness

I am reading the great book Delivering Happiness: A Path to Profits, Passion, and Purpose by Tony Hsieh, the CEO of Zappos.

Obviously, the book’s title inspired the title of this blog post. 

One of the Zappos core values is “build a positive team and family spirit,” and I have been thinking about how that applies to data quality improvements, which are often pursued as one of the many aspects of a data governance program.

Most data governance maturity models describe an organization’s evolution through a series of stages intended to measure its capability and maturity, tendency toward being reactive or proactive, and inclination to be project-oriented or program-oriented.

Most data governance programs are started by organizations that are confronted with a painfully obvious need for improvement.

The primary reason that the change management efforts of data governance are resisted is because they rely almost exclusively on negative methods—they emphasize broken business and technical processes, as well as bad data-related employee behaviors.

Although these problems exist and are the root cause of some of the organization’s failures, there are also unheralded processes and employees that prevented other problems from happening, which are the root cause of some of the organization’s successes.

“The best team members,” writes Hsieh while explaining the Zappos core values, “take initiative when they notice issues so that the team and the company can succeed.” 

“The best team members take ownership of issues and collaborate with other team members whenever challenges arise.” 

“The best team members have a positive influence on one another and everyone they encounter.  They strive to eliminate any kind of cynicism and negative interactions.”

The change management efforts of data governance and other enterprise information initiatives often make it sound like no such employees (i.e., “best team members”) currently exist anywhere within an organization. 

The blogosphere, as well as critically acclaimed books and expert presentations at major industry conferences, often seem to be in unanimous and unambiguous agreement in the message that they are broadcasting:

“Everything your organization is currently doing regarding data management is totally wrong!”

Sadly, that isn’t much of an exaggeration.  But I am not trying to accuse anyone of using Machiavellian sales tactics to sell solutions to non-existent problems—poor data quality and data governance maturity are costly realities for many organizations.

Nor am I trying to oversimplify the many real complexities involved when implementing enterprise information initiatives.

However, most of these initiatives focus exclusively on developing new solutions and best practices, failing to even acknowledge the possible presence of existing solutions and best practices.

The success of all enterprise information initiatives requires the kind of enterprise-wide collaboration that is facilitated by the “best team members.”  But where, exactly, do the best team members come from?  Should it really be surprising whenever an enterprise information initiative can’t find any using exclusively negative methods, focusing only on what is currently wrong?

As Gordon Hamilton commented on my previous post, we need to be “helping people rise to the level of the positive expectations, rather than our being codependent in their sinking to the level of the negative expectations.”

We really need to start using more positive methods for fostering change.

Let’s begin by first acknowledging the best team members who are currently delivering data happiness to our organizations.


Related Posts

Why isn’t our data quality worse?

The Road of Collaboration

Common Change

Finding Data Quality

Declaration of Data Governance

The Balancing Act of Awareness

Podcast: Business Technology and Human-Speak

“I can make glass tubes”

Why isn’t our data quality worse?

In psychology, the term negativity bias is used to explain how bad evokes a stronger reaction than good in the human mind.  Don’t believe that theory?  Compare receiving an insult with receiving a compliment—which one do you remember more often?

Now, this doesn’t mean the dark side of the Force is stronger, it simply means that we all have a natural tendency to focus more on the negative aspects, rather than on the positive aspects, of most situations, including data quality.

In the aftermath of poor data quality negatively impacting decision-critical enterprise information, the natural tendency is for a data quality initiative to begin by focusing on the now painfully obvious need for improvement, essentially asking the question:

Why isn’t our data quality better?

Although this type of question is a common reaction to failure, it is also indicative of the problem-seeking mindset caused by our negativity bias.  However, Chip and Dan Heath, authors of the great book Switch, explain that even in failure, there are flashes of success, and following these “bright spots” can illuminate a road map for action, encouraging a solution-seeking mindset.

“To pursue bright spots is to ask the question:

What’s working, and how can we do more of it?

Sounds simple, doesn’t it? 

Yet, in the real-world, this obvious question is almost never asked.

Instead, the question we ask is more problem focused:

What’s broken, and how do we fix it?”


Why isn’t our data quality worse?

For example, let’s pretend that a data quality assessment is performed on a data source used to make critical business decisions.  With the help of business analysts and subject matter experts, it’s verified that this critical source has an 80% data accuracy rate.

The common approach is to ask the following questions (using a problem-seeking mindset):

  • Why isn’t our data quality better?
  • What is the root cause of the 20% inaccurate data?
  • What process (business or technical, or both) is broken, and how do we fix it?
  • What people are responsible, and how do we correct their bad behavior?

But why don’t we ask the following questions (using a solution-seeking mindset):

  • Why isn’t our data quality worse?
  • What is the root cause of the 80% accurate data?
  • What process (business or technical, or both) is working, and how do we re-use it?
  • What people are responsible, and how do we encourage their good behavior?

I am not suggesting that we abandon the first set of questions, especially since there are times when a problem-seeking mindset might be a better approach (after all, it does also incorporate a solution-seeking mindset—albeit after a problem is identified).

I am simply wondering why we often never even consider asking the second set of questions?

Most data quality initiatives focus on developing new solutions—and not re-using existing solutions.

Most data quality initiatives focus on creating new best practices—and not leveraging existing best practices.

Perhaps you can be the chosen one who will bring balance to the data quality initiative by asking both questions:

Why isn’t our data quality better?  Why isn’t our data quality worse?

OCDQ Blog Bicentennial

Welcome to the Obsessive-Compulsive Data Quality (OCDQ) Blog Bicentennial Celebration!

Well, okay, technically a bicentennial is the 200th anniversary of something, and I haven’t been blogging for two hundred years. 

On March 13, 2009, I officially launched this blog.  Earlier this year, I published my 100th blog post.  Thanks to my prolific pace, facilitated by a copious amount of free time due to a rather slow consulting year, this is officially the 200th OCDQ Blog post!

So I decided to rummage through my statistics and archives, and assemble a retrospective of how this all came to pass.  Enjoy!


OCDQ Blog Numerology

The following table breaks down the OCDQ Blog statistics by month (clicking on the month link will take you to its blog archive), with subtotals by year, and overall totals for number of blog posts, unique visitors, and page views.  The most popular blog post for each month was determined using a pseudo-scientific quasi-statistical combination of page views, comments, and re-tweets.

Month

Posts

Unique Visitors

Page Views

Most Popular Blog Post

MAR 2009 5 623 3,347 You're So Vain, You Probably Think Data Quality Is About You
APR 2009 8 2,057 6,846 There are no Magic Beans for Data Quality
MAY 2009 5 2,048 5,084 The Nine Circles of Data Quality Hell
JUN 2009 5 2,105 4,785 Not So Strange Case of Dr. Technology and Mr. Business
JUL 2009 8 2,460 6,083 The Very True Fear of False Positives
AUG 2009 11 2,637 6,146 Hyperactive Data Quality (Second Edition)
SEP 2009 9 2,027 3,778 DQ-Tip: “Data quality is primarily about context not accuracy...”
OCT 2009 11 2,645 5,971 Days Without A Data Quality Issue
NOV 2009 9 2,227 4,177 Beyond a “Single Version of the Truth”
DEC 2009 13 1,698 3,779 Adventures in Data Profiling (Part 8)

2009

84

20,527

49,996


Month

Posts

Unique Visitors

Page Views

Most Popular Blog Post

JAN 2010 14 2,323 4,807 The Dumb and Dumber Guide to Data Quality
FEB 2010 12 2,988 6,296 The Wisdom of the Social Media Crowd
MAR 2010 14 3,548 6,869 The Circle of Quality
APR 2010 15 4,727 8,774 Data, data everywhere, but where is data quality?
MAY 2010 13 2,989 5,418 What going to the dentist taught me about data quality
JUN 2010 15 3,420 6,735 Jack Bauer and Enforcing Data Governance Policies
JUL 2010 13 3,410 8,600 Is your data complete and accurate, but useless to your business?
AUG 2010 17 4,047 8,195 The Real Data Value is Business Insight

2010

113

27,452

55,694


Posts

Unique Visitors

Page Views


Totals

197*

47,979

105,690


* Since this is the third one published in September 2010, it is officially the 200th OCDQ Blog post!


Some of my favorites

In addition to the most popular OCDQ Blog posts listed above by month, the following are some of my personal favorites:

  • The Three Musketeers of Data Quality — Although people, process, and technology are all necessary for data quality success, people are the most important of all.  So, who exactly are some of the most important people on your data quality project?
  • Fantasy League Data Quality — This blog post attempted to explain best practices in action for master data management, data warehousing, business intelligence, and data quality using . . . fantasy league baseball and football.
  • Blog-Bout: “Risk” versus “Monopoly” — A “blog-bout” is a good-natured debate between two bloggers.  Phil Simon and I debated which board game is the better metaphor for an Information Technology (IT) project: “Risk” or “Monopoly.”
  • Collablogaunity — Mashing together the words collaboration, blog, and community, I created the term collablogaunity (which is pronounced “Call a Blog a Unity”) to explain some recommended blogging best practices.
  • Do you enjoy writing? — A literally handwritten blog post about the art of painting with letters and words—aka writing.
  • MacGyver: Data Governance and Duct Tape — This allegedly Emmy Award nominated blog post explains data stewardship, data quality, data cleansing, defect prevention, and data governance—all with help from both MacGyver and Jill Dyché.
  • The Importance of Envelopes — No, this was not a blog post about postal address data quality.  Instead, I used envelopes as a metaphor for effective communication, explaining that the way we deliver our message is as important as our message.
  • Dilbert, Data Quality, Rabbits, and #FollowFriday — This blog post revealed a truth that all data quality experts know well: All data quality issues are caused by rabbits—either a cartoon rabbit named Roger, or an invisible rabbit named Harvey.
  • Finding Data Quality — With lots of help from the movie Finding Nemo, this blog post explains that although it is often discussed only in relation to other enterprise information initiatives, eventually you’ll be finding data quality everywhere.


Find your favorites

Find your favorites by browsing OCDQ Blog content using the following links:

  • Best of OCDQ — Periodically updated listings, organized by topic, of the best OCDQ Blog posts of all time


Thank You

So far, OCDQ Blog has received over 900 comments, which is an average of 50 comments per month, and 5 comments per post. 

Although a fair percentage of the total number of comments are my responses, Commendable Comments is my ongoing series (next entry coming later this month) that celebrates the truly commendable comments that I regularly receive from my readers.

Thank you very much to everyone who reads OCDQ Blog.  Whether you comment or not, your readership is deeply appreciated.

Pirates of the Computer: The Curse of the Poor Data Quality

This recent tweet (expanded using TwitLonger) by Ted Friedman of Gartner Research conspired with the swashbuckling movie Pirates of the Caribbean: The Curse of the Black Pearl, leading, really quite inevitably, to the writing of this Data Quality Tale.


Pirates of the Computer: The Curse of the Poor Data Quality

Jack Sparrow was once the Captain of Information Technology (IT) at the world famous Es el Pueblo Estúpido Corporation. 

However, when Jack revealed his plans for recommending to executive management the production implementation of the new Dystopian Automated Transactional Analysis (DATA) system and its seamlessly integrated Magic Beans software, his First Mate Barbossa mutinied by stealing the plans and successfully pitching the idea to the CIO—thereby getting Captain Sparrow fired.

As the new officially appointed Captain of IT, Barbossa implemented DATA and Magic Beans, which migrated and consolidated all of the organization’s information assets, clairvoyantly detected and corrected existing data quality problems, and once fully implemented into production, was preventing any future data quality problems from happening.

As soon as a source was absorbed into DATA, Magic Beans automatically freed up disk space by deleting all traces of the source, including all backups—somehow even the off-site archives.

DATA was then the only system of record, truly becoming the organization’s Single Version of the Truth.

DATA and Magic Beans seemed almost too good to be true.

And that’s because they were.

A few weeks after the last of the organization’s information assets had been fully integrated into DATA, it was discovered that Magic Beans was apparently infected with a nasty computer virus known as The Curse of the Poor Data Quality.

Mysterious “computer glitches” began causing bizarre data quality issues.  At first, the glitches seemed rather innocuous, such as resetting all user names to “TED FRIEDMAN” and all passwords to “GARTNER RESEARCH.”

But that’s hardly worth mentioning, especially when compared with what happened next.

All of the business-critical information stored in DATA—and all new information added—suddenly became completely inaccurate and totally useless as the basis for making any business decisions.

DATA and Magic Beans were cursed!  It was believed that the only way The Curse of the Poor Data Quality could be lifted was by re-installing the organization’s original systems and software.

William “Backup Bill” Turner, Jack’s only supporter, believing the organization deserved to remain cursed for betraying Jack, sent a USB drive to his young son, Will, which contained the only surviving backup copy of the original systems and software.

Many years later, Will Turner, still wearing his father’s old USB drive around his neck, but not knowing its alleged value, is told by Jack Sparrow that Captain Barbossa killed Will’s father and kidnapped Will’s ex-girlfriend, Elizabeth Swann.

Jack and Will infiltrate the DATA center disguised as PIRATEs (Professional Information Retrieval and Technology Experts). 

Jack tells Will that he needs the USB drive to determine where Elizabeth is being held.  Will gives Jack the USB drive and he uses it to begin restoring the original systems and software.  Moments later, Barbossa and Elizabeth walk into the DATA center.

“Elizabeth!  Don’t worry, I’m here to save you!” Will proudly declares.

“Will?” Elizabeth responds, confused.  “What are you talking about?  You’re here to save me from what?  My new job?”

Embarrassed, and turning toward Jack, Will shouts, “You told me Barbossa killed my father and kidnapped Elizabeth!”

“I’m terribly sorry, but I lied,” replies Jack.  “I’m a PIRATE, that’s what we do.”

“Killed your father?” Barbossa interjects.  “No, not literally.  Years ago, I killed a UNIX process he was running in production, and he threw a temper tantrum then quit.  I just hired Elizabeth last week in order to help us overcome our DATA problems.”

You are Jack Sparrow?” asks Elizabeth.  “You are, without doubt, the worst PIRATE I’ve ever heard of.”

“But you have heard of me,” replies Jack, proudly smiling.

“Security!” yells Barbossa.  “Please escort Mr. Sparrow out of the building—immediately!”

“That’s Captain Sparrow,” Jack retorts.  “And it’s too late, Barbossa!  I just restored the original systems and software.  Ha ha!  DATA and Magic Beans are no more!  Without doubt, this will earn my rightful reinstatement as the Captain of IT!”

“Oh no it won’t,” Barbossa responds slowly, while staring at his monitor in disbelief.  “DATA and Magic Beans are gone alright, but The Curse of the Poor Data Quality remains!”

“The what?” asks Elizabeth.

The Curse of the Poor Data Quality,” Barbossa angrily replies.  “All of our information assets are still completely inaccurate and totally useless as the basis for making any business decisions.  Therefore, we are still cursed with unresolved data quality issues!”

“What did you expect to happen?” remarks Will.  “Technology is never the solution to any problem.  Technology is the problem.  And unabated advancements in technology will eventually lead to computers becoming self-aware and taking over the world.”

Laughing, Barbossa asks, “You do realize that only happens in really bad movies, right?”

“No, curses only happen in really bad movies,” replies Will.  “Sentient computers taking over the world is really going to happen.  After all, it was very clearly explained in that excellent documentary series produced by the governor of California.”

“Oh, shut up Will!” shouts Elizabeth.  “I don’t won’t to hear another one of your anti-technology rants!  That’s why I broke up with you in the first place.  Although technology didn’t cause the data quality problems, Luddite Will is right about one thing, technology is not the solution.”

“What in blazes are you talking about?” Jack and Barbossa retort in unison.

“Seriously, I actually have to explain this?” replies Elizabeth.  “After all, the name of this corporation is Es el Pueblo Estúpido!”

Jack, Barbossa, and Will just stare at Elizabeth with puzzled looks on their faces.

“It’s Spanish for,” explains Elizabeth, “It’s the People, Stupid!

“Well, we don’t speak Spanish,” Barbossa and Jack reply.  “The only languages we speak are Machine Language, FORTRAN, LISP, COBOL, PL/I, BASIC, Pascal, C, C++, C#, Java, JavaScript, Perl, SQL, HTML, XML, PHP, Python, SPARQL . . .”

“Enough!” Elizabeth finally screams. 

“The point that I am trying to make is that although people, business processes, and yes, of course, technology, are all important for successful data quality management, by far the most important of all is . . . Do I really have to say it one more time?”

“It’s the People, Stupid!”

“This corporation should really be renamed to Todos los hombres son idiotas!” Elizabeth concludes, while shaking her head and looking at the clock.  “We can discuss all of this in more detail next week after I return from my Labor Day Weekend vacation.”

“You’re going away for Labor Day Weekend?” asks Will cheerily.  “Perhaps you would be so kind as to invite me to join you?”

“It’s a good thing you’re cute,” replies Elizabeth.  “Yes, you’re invited to join me, but you’ll have to carry my purse—all weekend.”

“Can we pretend,” Will says, grimacing as he reluctantly accepts her purse, “that I am carrying your laptop computer bag?”

“Oh sure, why not?” replies Elizabeth sarcastically with a sly smile.  “And while we’re at it, let’s all just continue pretending that the key to ongoing data quality improvement isn’t focusing more on people, their work processes, and their behaviors . . .”


Related Posts

Data Quality is People!

The Tell-Tale Data

There are no Magic Beans for Data Quality

Do you believe in Magic (Quadrants)?

Data Quality is not a Magic Trick

The Tooth Fairy of Data Quality

Which came first, the Data Quality Tool or the Business Need?

Predictably Poor Data Quality

The Scarlet DQ

The Poor Data Quality Jar

The Data-Decision Symphony

As I have explained in previous blog posts, I am almost as obsessive-compulsive about literature and philosophy as I am about data and data quality, because I believe that there is much that the arts and the sciences can learn from each other.

Therefore, I really enjoyed recently reading the book Proust Was a Neuroscientist by Jonah Lehrer, which shows that science is not the only path to knowledge.  In fact, when it comes to understanding the brain, art got there first.

Without doubt, I will eventually write several blog posts that use references from this book to help me explain some of my perspectives about data quality and its many related disciplines.

In this blog post, with help from Jonah Lehrer and the composer Igor Stravinsky, I will explain The Data-Decision Symphony.


Data, data everywhere

Data is now everywhere.  Data is no longer just in the structured rows of our relational databases and spreadsheets.  Data is also in the unstructured streams of our Facebook and Twitter status updates, as well as our blog posts, our photos, and our videos.

The challenge is can we somehow manage to listen for business insights among the endless cacophony of chaotic data volumes, and use those insights to enable better business decisions and deliver optimal business performance.

Whether you choose to measure it in terabytes, petabytes, or how much reality bites, the data deluge has commenced—and you had better bring your A-Game to D-Town.  In other words, you need to find innovative ways to derive business insight from your constantly increasing data volumes by overcoming the signal-to-noise ratio encountered during your data analysis.


The Music of the Data

This complex challenge of filtering out the noise of the data until you can detect the music of the data, which is just another way of saying the data that you need to make a critical business decision, is very similar to how we actually experience music.

As Jonah Lehrer explains, “music is nothing but a sliver of sound that we have learned how to hear.  Our sense of sound is a work in progress.  Neurons in the auditory cortex are constantly being altered by the songs and symphonies we listen to.”

“Instead of representing the full spectrum of sound waves vibrating inside the ear, the auditory cortex focuses on finding the note amid the noise.  We tune out the cacophony we can’t understand.”

“This is why we can recognize a single musical pitch played by different instruments.  Although a trumpet and violin produce very different sound waves, we are designed to ignore these differences.  All we care about is pitch.”

Instead of attempting to analyze all of the available data before making a business decision, we need to focus on finding the right data signals amid the data noise.  We need to tune out the cacophony of all the data we don’t need.

Of course, this is easier in theory than it is in practice.

But this is why we need to always begin our data analysis with the business decision in mind.  Many organizations begin with only the data in mind, which results in performing analysis that provides little, if any, business insight and decision support.

“But a work of music,” Lehrer continues, “is not simply a set of individual notes arranged in time.”

“Music really begins when the separate pitches are melted into a pattern.  This is a consequence of the brain’s own limitations.  Music is the pleasurable overflow of information.  Whenever a noise exceeds our processing abilities . . . [we stop] . . . trying to understand the individual notes and seek instead to understand the relationship between the notes.”

“It is this psychological instinct—this desperate neuronal search for a pattern, any pattern—that is the source of music.”

Although few would describe analyzing large volumes of data as a “pleasurable overflow of information,” it is our search for a pattern, any pattern in the data relevant to the decision, which allows us to discover a potential source of business insight.


The Data-Decision Symphony

“When we listen to a symphony,” explains Lehrer, “we hear a noise in motion, each note blurring into the next.”

“The sound seems continuous.  Of course, the physical reality is that each sound wave is really a separate thing, as discrete as the notes written in the score.  But this isn’t the way we experience the music.”

“We continually abstract on our own inputs, inventing patterns in order to keep pace with the onrush of noise.  And once the brain finds a pattern, it immediately starts to make predictions, imagining what notes will come next.  It projects imaginary order into the future, transposing the melody we have just heard into the melody we expect.  By listening for patterns, by interpreting every note in terms of expectations, we turn the scraps of sound into the ebb and flow of a symphony.”

This is also how we arrive at making a critical business decision based on data analysis. 

We discover a pattern of business context, relevant to the decision, and start making predictions, imagining what will come next, projecting imaginary order into the data stream, turning bits and bytes into the ebb and flow of The Data-Decision Symphony.

However, our search for the consonance of business context among the dissonance of data, could cause us to draw comforting, but false, conclusions—especially if unaware of any confirmation bias—resulting in bad, albeit data-driven, business decisions.

The musicologist Leonard Meyer, in his 1956 book Emotion and Meaning in Music, explained how “music is defined by its flirtation with—but not submission to—expectations of order.  Although music begins with our predilection for patterns, the feeling of music begins when the pattern we imagine starts to break down.”

Lehrer explains how Igor Stravinsky, in The Rite of Spring, “forces us to generate patterns from the music itself, and not from our preconceived notions of what the music should be like.”

Therefore, we must be vigilant when we perform data analysis, making sure to generate patterns from the data itself, and not from our preconceived notions of what the data should be like—especially when we encounter less than perfect data quality.

As Jonah Lehrer explains, “the brain is designed to learn by association: if this, then that.  Music works by subtly toying with our expected associations, enticing us to make predictions and then confronting us with our prediction errors.”

“Music is the sound of art changing the brain.”

The Data-Decision Symphony is the sound of the art and science of data analysis enabling better business decisions.


Related Posts

Data, data everywhere, but where is data quality?

The Real Data Value is Business Insight

The Road of Collaboration

The Idea of Order in Data

Hell is other people’s data

The Circle of Quality


Data Quality Music (DQ-Songs)

A Record Named Duplicate

New Time Human Business

People

You Can’t Always Get the Data You Want

A spoonful of sugar helps the number of data defects go down

Data Quality is such a Rush

I’m Bringing DQ Sexy Back

Imagining the Future of Data Quality

The Very Model of a Modern DQ General

Video: Oh, the Data You’ll Show!

In May, I wrote a Dr. Seuss style blog post called Oh, the Data You’ll Show! inspired by the great book Oh, the Places You'll Go!

In the following video, I have recorded my narration of the presentation format of my original blog post.  Enjoy!


Oh, the Data You’ll Show!


If you are having trouble viewing this video, then you can watch it on Vimeo by clicking on this link: Oh, the Data You’ll Show!

And you can download the presentation (PDF file) used in the video by clicking on this link: Oh, the Data You’ll Show! (Slides)

And you can listen to and/or download the podcast (MP3 file) by clicking on this link: Oh, the Data You’ll Show! (Podcast)

“Some is not a number and soon is not a time”

In a true story that I recently read in the book Switch: How to Change Things When Change Is Hard by Chip and Dan Heath, back in 2004, Donald Berwick, a doctor and the CEO of the Institute for Healthcare Improvement, had some ideas about how to reduce the defect rate in healthcare, which, unlike the vast majority of data defects, was resulting in unnecessary patient deaths.

One common defect was deaths caused by medication mistakes, such as post-surgical patients failing to receive their antibiotics in the specified time, and another common defect was mismanaging patients on ventilators, resulting in death from pneumonia.

Although Berwick initially laid out a great plan for taking action, which proposed very specific process improvements, and was supported by essentially indisputable research, few changes were actually being implemented.  After all, his small, not-for-profit organization had only 75 employees, and had no ability whatsoever to force any changes on the healthcare industry.

So, what did Berwick do?  On December 14, 2004, in a speech that he delivered to a room full of hospital administrators at a major healthcare industry conference, he declared:

“Here is what I think we should do.  I think we should save 100,000 lives.

And I think we should do that by June 14, 2006—18 months from today.

Some is not a number and soon is not a time.

Here’s the number: 100,000.

Here’s the time: June 14, 2006—9 a.m.”

The crowd was astonished.  The goal was daunting.  Of course, all the hospital administrators agreed with the goal to save lives, but for a hospital to reduce its defect rate, it has to first acknowledge having a defect rate.  In other words, it has to admit that some patients are dying needless deaths.  And, of course, the hospital lawyers are not keen to put this admission on the record.


Data Denial

Whenever an organization’s data quality problems are discussed, it is very common to encounter data denial.  Most often, this is a natural self-defense mechanism for the people responsible for business processes, technology, and data—and understandable because of the simple fact that nobody likes to be blamed (or feel blamed) for causing or failing to fix the data quality problems.

But data denial can also doom a data quality improvement initiative from the very beginning.  Of course, everyone will agree that ensuring high quality data is being used to make critical daily business decisions is vitally important to corporate success, but for an organization to reduce its data defects, it has to first acknowledge having data defects.

In other words, the organization has to admit that some business decisions are mistakes being made based on poor quality data.


Half Measures

In his excellent recent blog post Half Measures, Phil Simon discussed the compromises often made during data quality initiatives, half measures such as “cleaning up some of the data, postponing parts of the data cleanup efforts, and taking a wait and see approach as more issues are unearthed.”

Although, as Phil explained, it is understandable that different individuals and factions within large organizations will have vested interests in taking action, just as others are biased towards maintaining the status quo, “don’t wait for the perfect time to cleanse your data—there isn’t any.  Find a good time and do what you can.”


Remarkable Data Quality

As Seth Godin explained in his remarkable book Purple Cow: Transform Your Business by Being Remarkable, the opposite of remarkable is not bad or mediocre or poorly done.  The opposite of remarkable is very good.

In other words, you must first accept that your organization has data defects, but most important, since some is not a number and soon is not a time, you must set specific data quality goals and specific times when you will meet (or exceed) your goals.

So, what happened with Berwick’s goal?  Eighteen months later, at the exact moment he’d promised to return—June 14, 2006, at 9 a.m.—Berwick took the stage again at the same major healthcare industry conference, and announced the results:

“Hospitals enrolled in the 100,000 Lives Campaign have collectively prevented an estimated 122,300 avoidable deaths and, as importantly, have begun to institutionalize new standards of care that will continue to save lives and improve health outcomes into the future.”

Although improving your organization’s data quality—unlike reducing defect rates in healthcare—isn’t a matter of life and death, remarkable data quality is becoming a matter of corporate survival in today’s highly competitive and rapidly evolving world.

Perfect data quality is impossible—but remarkable data quality is not.  Be remarkable.

Data Quality is not a Magic Trick

Data Quality (DQ) View is an OCDQ regular segment.  Each DQ-View is a brief video discussion of a data quality key concept.

If you are having trouble viewing this video, then you can watch it on Vimeo by clicking on this link: DQ-View on Vimeo

You can also watch a regularly updated page of my videos by clicking on this link: OCDQ Videos


Data Stewards make the Real Magic Happen

By November 4, 2013 nominate a data steward whom you believe should be recognized as the 2013 Data Steward of the Year.


Related Posts

DQ-View: The Five Stages of Data Quality

DQ-View: MetaData makes BettahMusic

DQ-View: Data Is as Data Does

DQ-View: Baseball and Data Quality

DQ-View: Occam’s Razor Burn

DQ-View: Roman Ruts on the Road to Data Governance

DQ-View: Talking about Data

DQ-View: The Poor Data Quality Blizzard

DQ-View: New Data Resolutions

DQ-View: From Data to Decision

DQ View: Achieving Data Quality Happiness

DQ-View: The Cassandra Effect

DQ-View: Is Data Quality the Sun?

DQ-View: Designated Asker of Stupid Questions

The Real Data Value is Business Insight

Data Values for COUNTRY Understanding your data usage is essential to improving its quality, and therefore, you must perform data analysis on a regular basis.

A data profiling tool can help you by automating some of the grunt work needed to begin your data analysis, such as generating levels of statistical summaries supported by drill-down details, including data value frequency distributions (like the ones shown to the left).

However, a common mistake is to hyper-focus on the data values.

Narrowing your focus to the values of individual fields is a mistake when it causes you to lose sight of the wider context of the data, which can cause other errors like mistaking validity for accuracy.

Understanding data usage is about analyzing its most important context—how your data is being used to make business decisions.


“Begin with the decision in mind”

In his excellent recent blog post It’s time to industrialize analytics, James Taylor wrote that “organizations need to be much more focused on directing analysts towards business problems.”  Although Taylor was writing about how, in advanced analytics (e.g., data mining, predictive analytics), “there is a tendency to let analysts explore the data, see what can be discovered,” I think this tendency is applicable to all data analysis, including less advanced analytics like data profiling and data quality assessments.

Please don’t misunderstand—Taylor and I are not saying that there is no value in data exploration, because, without question, it can definitely lead to meaningful discoveries.  And I continue to advocate that the goal of data profiling is not to find answers, but instead, to discover the right questions.

However, as Taylor explained, it is because “the only results that matter are business results” that data analysis should always “begin with the decision in mind.  Find the decisions that are going to make a difference to business results—to the metrics that drive the organization.  Then ask the analysts to look into those decisions and see what they might be able to predict that would help make better decisions.”

Once again, although Taylor is discussing predictive analytics, this cogent advice should guide all of your data analysis.


The Real Data Value is Business Insight

The Real Data Value is Business Insight

Returning to data quality assessments, which create and monitor metrics based on summary statistics provided by data profiling tools (like the ones shown in the mockup to the left), elevating what are low-level technical metrics up to the level of business relevance will often establish their correlation with business performance, but will not establish metrics that drive—or should drive—the organization.

Although built from the bottom-up by using, for the most part, the data value frequency distributions, these metrics lose sight of the top-down fact that business insight is where the real data value lies.

However, data quality metrics such as completeness, validity, accuracy, and uniqueness, which are just a few common examples, should definitely be created and monitored—unfortunately, a single straightforward metric called Business Insight doesn’t exist.

But let’s pretend that my other mockup metrics were real—50% of the data is inaccurate and there is an 11% duplicate rate.

Oh, no!  The organization must be teetering on the edge of oblivion, right?  Well, 50% accuracy does sound really bad, basically like your data’s accuracy is no better than flipping a coin.  However, which data is inaccurate, and far more important, is the inaccurate data actually being used to make a business decision?

As for the duplicate rate, I am often surprised by the visceral reaction it can trigger, such as: “how can we possibly claim to truly understand who our most valuable customers are if we have an 11% duplicate rate?”

So, would reducing your duplicate rate to only 1% automatically result in better customer insight?  Or would it simply mean that the data matching criteria was too conservative (e.g., requiring an exact match on all “critical” data fields), preventing you from discovering how many duplicate customers you have?  (Or maybe the 11% indicates the matching criteria was too aggressive).

My point is that accuracy and duplicate rates are just numbers—what determines if they are a good number or a bad number?

The fundamental question that every data quality metric you create must answer is: How does this provide business insight?

If a data quality (or any other data) metric can not answer this question, then it is meaningless.  Meaningful metrics always represent business insight because they were created by beginning with the business decisions in mind.  Otherwise, your metrics could provide the comforting, but false, impression that all is well, or you could raise red flags that are really red herrings.

Instead of beginning data analysis with the business decisions in mind, many organizations begin with only the data in mind, which results in creating and monitoring data quality metrics that provide little, if any, business insight and decision support.

Although analyzing your data values is important, you must always remember that the real data value is business insight.


Related Posts

The First Law of Data Quality

Adventures in Data Profiling

Data Quality and the Cupertino Effect

Is your data complete and accurate, but useless to your business?

The Idea of Order in Data

You Can’t Always Get the Data You Want

Red Flag or Red Herring? 

DQ-Tip: “There is no point in monitoring data quality…”

Which came first, the Data Quality Tool or the Business Need?

Selling the Business Benefits of Data Quality

The Road of Collaboration

The Road Not Taken by Robert Frost I grew up and lived most of my life in the suburbs of Boston, Massachusetts.  But just prior to relocating to the Midwest for work seven years ago, I lived in Derry, New Hampshire, just down the road from the historic landmark where Robert Frost, the famous American poet who was also a four-time recipient of the Pulitzer Prize for Poetry, wrote many of his best poems, including the one shown to the left, The Road Not Taken, which has always remained one of my favorite poems—and also provides the inspiration for this blog post.

Historically, there have been only two “roads” diverged in the corporate world, two well-traveled ways: The Road of Business and The Road of Technology.

Although these two roads have a common starting point near the center of an organization, they will almost always extend away from each other, and in completely opposite directions, leaving most employees to choose which road they wish to travel—often without being sorry that they could not travel both.

I don’t believe that I am taking too much of a poetic license in describing this common calamity as how an organization is “a house divided against itself,” which to paraphrase Abraham Lincoln, cannot succeed.  I believe that no organization can succeed as half business and half technical.  But I also do not believe that any organization must become either all business or all technical.

There is a third option—there is a third road diverged in the corporate world.

Organizations struggle with the business/technical divided house because they believe the corporate world is comprised of technical workers delivering and maintaining the things that enable business workers to do their things.

And of course, there can be an almost Lincoln–Douglas debate about what exactly each of those things are because, in part, it is commonly perceived that they operate independently of one another—whereas the truth is that they are highly interdependent.

However, it’s no debate that organizations suffer from this perception of a deep divide separating the business side of the house, who usually own its data and understand its use in making critical daily business decisions, from the technical side of the house, who usually own and maintain its hardware and software infrastructure, which comprise its enterprise data architecture.

The success of all enterprise information initiatives is highly dependent upon enterprise-wide interdependence—aka collaboration.

Therefore, in order for success to be possible with data quality, data integration, master data management, data warehousing, business intelligence, data governance, etc., your organization needs to travel the third road diverged in the corporate world.

The Road of Collaboration is long and winding, a seemingly strange and unfamiliar road, quite distinct from the well-traveled, long, but straight and narrow, and somewhat easily foreseeable paths of The Road of Business and The Road of Technology.

Your organization must abandon the comforts of the familiar roads and embrace the discomfort of the unfamiliar road, the road that although less traveled by, definitely makes all the difference between whether your entire house will succeed or fail.

But if The Road of Collaboration does not yet exist within your organization, then you can not afford to settle for continuing to travel down whatever path you currently follow.  Instead, you must follow the trailblazing advice of Ralph Waldo Emerson:

“Do not go where the path may lead; go instead where there is no path and leave a trail.”

Neither trailblazing, nor taking the road less traveled by, will be an easy journey.  And there is no escaping the harsh reality that The Road of Collaboration will always be the path of the greatest resistance.

But which story do you want to be telling—and without a sigh—somewhere ages and ages hence?

Do you want to tell the story about how your organization continued to walk away from each other by traveling separately down The Road of Business and The Road of Technology—leaving The Road of Collaboration as The Road Not Taken?

Or do you want to tell the story about how your organization chose to walk together by traveling The Road of Collaboration?

Three roads diverged in the corporate world, and our organization—
Our organization took the one less traveled by,
And that has made all the difference.

Related Posts

Scrum Screwed Up

The Idea of Order in Data

Finding Data Quality

Data Transcendentalism

Declaration of Data Governance

The Prince of Data Governance

Jack Bauer and Enforcing Data Governance Policies

Podcast: Business Technology and Human-Speak

The Dumb and Dumber Guide to Data Quality

Not So Strange Case of Dr. Technology and Mr. Business

The Tooth Fairy of Data Quality

Tooth Fairy

The 2010 movie Tooth Fairy was a box office bust—and deservedly so for obvious reasons.  The studio executives couldn’t handle the tooth, er I mean, the truth, which is before Jim Piddock stole, modified, and sold my idea, the original plot centered around Dwayne “The DQ Expert” Johnson, who is a dentist by day, but at night becomes a crime fighter battling poor data quality, who is known only as The Tooth Fairy of Data Quality.

Okay, so obviously the real truth that’s all too easy to handle is that nobody really stole my idea for a movie about a data quality crime fighter who uses the tag line: “Can you smell the bad data The DQ Expert is cleansing?”

However, some of the organizations that I discuss data quality with seem like they really do believe in The Tooth Fairy of Data Quality

No, they don’t literally put their poor quality data under their pillow at night, going to sleep believing when they wake up the next morning that they will magically have high quality data—or at least get $1 for every bad data record.

But they do often act as if they believe that simply loading all of their existing data into a shiny new system, like say an enterprise data warehouse (EDW) or a master data management (MDM) hub, will magically resolve all of their enterprise-wide data issues, resulting in brightly smiling, happy business users.


Data Quality Fairy Tales

Please post a comment below and share your experiences dealing with this or any other fairy tales about data quality that you have encountered.  Perhaps we could even collectively create a new literary or movie genre for Data Quality Fairy Tales.


Anatomy of an OCDQ Blog Post

Since I am often asked by my readers where I get the wacky ideas for some of my data quality blog posts, I thought I would share the Twitter-aided thought process that lead—really quite inevitably—to the writing of this particular blog post:

Therefore, special thanks to Robert Karel of Forrester Research and Steve Sarsfield of Talend for “inspiring” this blog post.


Related Posts

Finding Data Quality

The Quest for the Golden Copy

Oh, the Data You’ll Show!

My Own Private Data

The Tell-Tale Data

Data Quality is People!

There are no Magic Beans for Data Quality

Scrum Screwed Up

This was the inaugural cartoon on Implementing Scrum by Michael Vizdos and Tony Clark, which does a great job of illustrating the fable of The Chicken and the Pig used to describe the two types of roles involved in Scrum, which, quite rare for our industry, is not an acronym, but one common approach among many iterative, incremental frameworks for agile software development.

Scrum is also sometimes used as a generic synonym for any agile framework.  Although I’m not an expert, I’ve worked on more than a few agile programs.  And since I am fond of metaphors, I will use the Chicken and the Pig to describe two common ways that scrums of all kinds can easily get screwed up:

  1. All Chicken and No Pig
  2. All Pig and No Chicken

However, let’s first establish a more specific context for agile development using one provided by a recent blog post on the topic.


A Contrarian’s View of Agile BI

In her excellent blog post A Contrarian’s View of Agile BI, Jill Dyché took a somewhat unpopular view of a popular view, which is something that Jill excels at—not simply for the sake of doing it—because she’s always been well-known for telling it like it is.

In preparation for the upcoming TDWI World Conference in San Diego, Jill was pondering the utilization of agile methodologies in business intelligence (aka BI—ah, there’s one of those oh so common industry acronyms straight out of The Acronymicon).

The provocative TDWI conference theme is: “Creating an Agile BI Environment—Delivering Data at the Speed of Thought.”

Now, please don’t misunderstand.  Jill is an advocate for doing agile BI the right way.  And it’s certainly understandable why so many organizations love the idea of agile BI.  Especially when you consider the slower time to value of most other approaches when compared with, following Jill’s rule of thumb, how agile BI would have “either new BI functionality or new data deployed (at least) every 60-90 days.  This approach establishes BI as a program, greater than the sum of its parts.”

“But in my experience,” Jill explained, “if the organization embracing agile BI never had established BI development processes in the first place, agile BI can be a road to nowhere.  In fact, the dirty little secret of agile BI is this: It’s companies that don’t have the discipline to enforce BI development rigor in the first place that hurl themselves toward agile BI.”

“Peek under the covers of an agile BI shop,” Jill continued, “and you’ll often find dozens or even hundreds of repeatable canned BI reports, but nary an advanced analytics capability. You’ll probably discover an IT organization that failed to cultivate solid relationships with business users and is now hiding behind an agile vocabulary to justify its own organizational ADD. It’s lack of accountability, failure to manage a deliberate pipeline, and shifting work priorities packaged up as so much scrum.”

I really love the term Organizational Attention Deficit Disorder, and in spite of myself, I can’t help but render it acronymically as OADD—which should be pronounced as “odd” because the “a” is silent, as in: “Our organization is really quite OADD, isn’t it?”


Scrum Screwed Up: All Chicken and No Pig

Returning to the metaphor of the Scrum roles, the pigs are the people with their bacon in the game performing the actual work, and the chickens are the people to whom the results are being delivered.  Most commonly, the pigs are IT or the technical team, and the chickens are the users or the business team.  But these scrum lines are drawn in the sand, and therefore easily crossed.

Many organizations love the idea of agile BI because they are thinking like chickens and not like pigs.  And the agile life is always easier for the chicken because they are only involved, whereas the pig is committed.

OADD organizations often “hurl themselves toward agile BI” because they’re enamored with the theory, but unrealistic about what the practice truly requires.  They’re all-in when it comes to the planning, but bacon-less when it comes to the execution.

This is one common way that OADD organizations can get Scrum Screwed Up—they are All Chicken and No Pig.


Scrum Screwed Up: All Pig and No Chicken

Closer to the point being made in Jill’s blog post, IT can pretend to be pigs making seemingly impressive progress, but although they’re bringing home the bacon, it lacks any real sizzle because it’s not delivering any real advanced analytics to business users. 

Although they appear to be scrumming, IT is really just screwing around with technology, albeit in an agile manner.  However, what good is “delivering data at the speed of thought” when that data is neither what the business is thinking, nor truly needs?

This is another common way that OADD organizations can get Scrum Screwed Up—they are All Pig and No Chicken.


Scrum is NOT a Silver Bullet

Scrum—and any other agile framework—is not a silver bullet.  However, agile methodologies can work—and not just for BI.

But whether you want to call it Chicken-Pig Collaboration, or Business-IT Collaboration, or Shiny Happy People Holding Hands, a true enterprise-wide collaboration facilitated by a cross-disciplinary team is necessary for any success—agile or otherwise.

Agile frameworks, when implemented properly, help organizations realistically embrace complexity and avoid oversimplification, by leveraging recurring iterations of relatively short duration that always deliver data-driven solutions to business problems. 

Agile frameworks are successful when people take on the challenge united by collaboration, guided by effective methodology, and supported by enabling technology.  Agile frameworks allow the enterprise to follow what works, for as long as it works, and without being afraid to adjust as necessary when circumstances inevitably change.

For more information about Agile BI, follow Jill Dyché and TDWI World Conference in San Diego, August 15-20 via Twitter.

Dilbert, Data Quality, Rabbits, and #FollowFriday

For truly comic relief, there is perhaps no better resource than Scott Adams and the Dilbert comic strip

Special thanks to Jill Wanless (aka @sheezaredhead) for tweeting this recent Dilbert comic strip, which perfectly complements one of the central themes of this blog post.


Data Quality: A Tail of Two Rabbits

Since this recent tweet of mine understandably caused a little bit of confusion in the Twitterverse, let me attempt to explain. 

In my recent blog post Who Framed Data Entry?, I investigated that triangle of trouble otherwise known as data, data entry, and data quality, where I explained that although high quality data can be a very powerful thing, since it’s a corporate asset that serves as a solid foundation for business success, sometimes in life, when making a critical business decision, what appears to be bad data is the only data we have—and one of the most commonly cited root causes of bad data is the data entered by people.

However, as my good friend Phil Simon facetiously commented, “there’s no such thing as a people-related data quality issue.”

And, as always, Phil is right.  All data quality issues are caused—not by people—but instead, by one of the following two rabbits:

Roger Rabbit
Roger Rabbit

Harvey Rabbit
Harvey Rabbit

Roger is the data quality trickster with the overactive sense of humor, which can easily handcuff a data quality initiative because he’s always joking around, always talking or tweeting or blogging or surfing the web.  Roger seems like he’s always distracted.  He never seems focused on what he’s supposed to be doing.  He never seems to take anything about data quality seriously at all. 

Well, I guess th-th-th-that’s all to be expected folks—after all, Roger is a cartoon rabbit, and you know how looney ‘toons can be.

As for Harvey, well, he’s a rabbit of few words, but he takes data quality seriously—he’s a bit of a perfectionist about it, actually.  Harvey is also a giant invisible rabbit who is six feet tall—well, six feet, three and a half inches tall, to be complete and accurate.

Harvey and I sit in bars . . . have a drink or two . . . play the jukebox.  And soon, all the other so-called data quality practitioners turn toward us and smile.  And they’re saying, “We don’t know anything about your data, mister, but you’re a very nice fella.” 

Harvey and I warm ourselves in these golden moments.  We’ve entered a bar as lonely strangers without any friends . . . but then we have new friends . . . and they sit with us . . . and they drink with us . . . and they talk to us about their data quality problems. 

They tell us about big terrible things they’ve done to data and big wonderful things they’ll do with their new data quality tools. 

They tell us all about their data hopes and their data regrets, and they tell us all about their golden copies and their data defects.  All very large, because nobody ever brings anything small into a data quality discussion at a bar.  And then I introduce them to Harvey . . . and he’s bigger and grander than anything that anybody’s data quality tool has ever done for me or my data.

And when they leave . . . they leave impressed.  Now, it’s true . . . yes, it’s true that the same people seldom come back, but that’s just data quality envy . . . there’s a little bit of data quality envy in even the very best of us so-called data quality practitioners.

Well, thank you Harvey!  I always enjoy your company too. 

But, you know Harvey, maybe Roger has a point after all.  Maybe the most important thing is to always maintain our sense of humor about data quality.  Like Roger always says—yes, Harvey, Roger always says because Roger never shuts up—Roger says:

“A laugh can be a very powerful thing.  Why, sometimes in life, it’s the only weapon we have.”

Really great non-rabbits to follow on Twitter

Since this blog post was published on a Friday, which for Twitter users like me means it’s FollowFriday, I would like to conclude by providing a brief list of some really great non-rabbits to follow on Twitter.

(Please Note: This is by no means a comprehensive list, is listed in no particular order whatsoever, and no offense is intended to any of my tweeps not listed below.  I hope that everyone has a great #FollowFriday and an even greater weekend.)


Related Posts

Comic Relief: Dilbert on Project Management

Comic Relief: Dilbert to the Rescue

Who Framed Data Entry?

A Tale of Two Q’s

Twitter, Meaningful Conversations, and #FollowFriday

The Fellowship of #FollowFriday

Video: Twitter #FollowFriday – January 15, 2010

Social Karma (Part 7)

Worthy Data Quality Whitepapers (Part 3)

In my April 2009 blog post Data Quality Whitepapers are Worthless, I called for data quality whitepapers worth reading.

This post is now the third entry in an ongoing series about data quality whitepapers that I have read and can endorse as worthy.


Matching Technology Improves Data Quality

Steve Sarsfield recently published Matching Technology Improves Data Quality, a worthy data quality whitepaper, which is a primer on the elementary principles, basic theories, and strategies of record matching.

This free whitepaper is available for download from Talend (requires registration by providing your full contact information).

The whitepaper describes the nuances of deterministic and probabilistic matching and the algorithms used to identify the relationships among records.  It covers the processes to employ in conjunction with matching technology to transform raw data into powerful information that drives success in enterprise applications, including customer relationship management (CRM), data warehousing, and master data management (MDM).

Steve Sarsfield is the Talend Data Quality Product Marketing Manager, and author of the book The Data Governance Imperative and the popular blog Data Governance and Data Quality Insider.


Whitepaper Excerpts

Excerpts from Matching Technology Improves Data Quality:

  • “Matching plays an important role in achieving a single view of customers, parts, transactions and almost any type of data.”
  • “Since data doesn’t always tell us the relationship between two data elements, matching technology lets us define rules for items that might be related.”
  • “Nearly all experts agree that standardization is absolutely necessary before matching.  The standardization process improves matching results, even when implemented along with very simple matching algorithms.  However, in combination with advanced matching techniques, standardization can improve information quality even more.”
  • “There are two common types of matching technology on the market today, deterministic and probabilistic.”
  • “Deterministic or rules-based matching is where records are compared using fuzzy algorithms.”
  • “Probabilistic matching is where records are compared using statistical analysis and advanced algorithms.”
  • “Data quality solutions often offer both types of matching, since one is not necessarily superior to the other.”
  • “Organizations often evoke a multi-match strategy, where matching is analyzed from various angles.”
  • “Matching is vital to providing data that is fit-for-use in enterprise applications.”
 

Related Posts

Identifying Duplicate Customers

Customer Incognita

To Parse or Not To Parse

The Very True Fear of False Positives

Data Governance and Data Quality

Worthy Data Quality Whitepapers (Part 2)

Worthy Data Quality Whitepapers (Part 1)

Data Quality Whitepapers are Worthless