Big Data and Big Analytics

OCDQ Radio is a vendor-neutral podcast about data quality and its related disciplines, produced and hosted by Jim Harris.

Jill Dyché is the Vice President of Thought Leadership and Education at DataFlux.  Jill’s role at DataFlux is a combination of best-practice expert, key client advisor and all-around thought leader.  She is responsible for industry education, key client strategies and market analysis in the areas of data governance, business intelligence, master data management and customer relationship management.  Jill is a regularly featured speaker and the author of several books.

Jill’s latest book, Customer Data Integration: Reaching a Single Version of the Truth (Wiley & Sons, 2006), was co-authored with Evan Levy and shows the business breakthroughs achieved with integrated customer data.

Dan Soceanu is the Director of Product Marketing and Sales Enablement at DataFlux.  Dan manages global field sales enablement and product marketing, including product messaging and marketing analysis.  Prior to joining DataFlux in 2008, Dan has held marketing, partnership and market research positions with Teradata, General Electric and FormScape, as well as data management positions in the Financial Services sector.

Dan received his Bachelor of Science in Business Administration from Kutztown University of Pennsylvania, as well as earning his Master of Business Administration from Bloomsburg University of Pennsylvania.

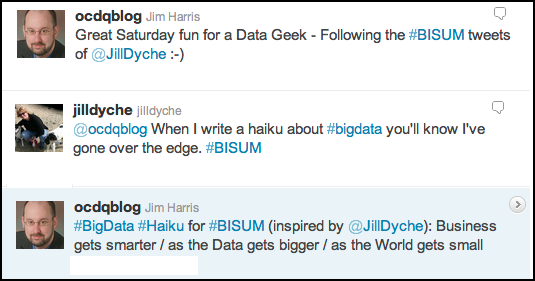
On this episode of OCDQ Radio, Jill Dyché, Dan Soceanu, and I discuss the recent Pacific Northwest BI Summit, where the three core conference topics were Cloud, Collaboration, and Big Data, the last of which lead to a discussion about Big Analytics.

Popular OCDQ Radio Episodes

Clicking on the link will take you to the episode’s blog post:

  • Demystifying Data Science — Guest Melinda Thielbar, a Ph.D. Statistician, discusses what a data scientist does and provides a straightforward explanation of key concepts such as signal-to-noise ratio, uncertainty, and correlation.
  • Data Quality and Big Data — Guest Tom Redman (aka the “Data Doc”) discusses Data Quality and Big Data, including if data quality matters less in larger data sets, and if statistical outliers represent business insights or data quality issues.
  • Demystifying Master Data Management — Guest John Owens explains the three types of data (Transaction, Domain, Master), the four master data entities (Party, Product, Location, Asset), and the Party-Role Relationship, which is where we find many of the terms commonly used to describe the Party master data entity (e.g., Customer, Supplier, Employee).
  • Data Governance Star Wars — Special Guests Rob Karel and Gwen Thomas joined this extended, and Star Wars themed, discussion about how to balance bureaucracy and business agility during the execution of data governance programs.
  • The Johari Window of Data Quality — Guest Martin Doyle discusses helping people better understand their data and assess its business impacts, not just the negative impacts of bad data quality, but also the positive impacts of good data quality.
  • Studying Data Quality — Guest Gordon Hamilton discusses the key concepts from recommended data quality books, including those which he has implemented in his career as a data quality practitioner.

Are you turning Ugly Data into Cute Information?

Sometimes the ways of the data force are difficult to understand precisely because they are sometimes difficult to see.

Daragh O Brien and I were discussing this recently on Twitter, where tweets about data quality and information quality form the midi-chlorians of the data force.  Share disturbances you’ve felt in the data force using the #UglyData and #CuteInfo hashtags.


Presentation Quality

Perhaps one of the most common examples of the difference between data and information is the presentation layer created for business users.  In her fantastic book Executing Data Quality Projects: Ten Steps to Quality Data and Trusted Information, Danette McGilvray defines Presentation Quality as “a measure of how information is presented to, and collected from, those who utilize it.  Format and appearance support appropriate use of the information.”

Tom Redman emphasizes the two most important points in the data lifecycle are when data is created and when data is used.

I describe the connection between those two points as the Data-Information Bridge.  By passing over this bridge, data becomes the information used to make the business decisions that drive the tactical and strategic initiatives of the organization.  Some of the most important activities of enterprise data management actually occur on the Data-Information Bridge, where preventing critical disconnects between data creation and data usage is essential to the success of the organization’s business activities.

Defect prevention and data cleansing are two of the required disciplines of an enterprise-wide data quality program.  Defect prevention is focused on the moment of data creation, attempting to enforce better controls to prevent poor data quality at the source.  Data cleansing can either be used to compensate for a lack of defect prevention, or it can be included in the processing that prepares data for a specific use (i.e., transforms data into information fit for the purpose of a specific business use.)


The Dark Side of Data Cleansing

In a previous post, I explained that although most organizations acknowledge the importance of data quality, they don’t believe that data quality issues occur very often because the information made available to end users in dashboards and reports often passes through many processes that cleanse or otherwise sanitize the data before it reaches them.

ETL processes that extract source data for a data warehouse load will often perform basic data quality checks.  However, a fairly standard practice for “resolving” a data quality issue is to substitute either a missing or default value (e.g., a date stored in a text field in the source, which can not be converted into a valid date value, is loaded with either a NULL value or the processing date).

When postal address validation software generates a valid mailing address, it often does so by removing what it considers to be “extraneous” information from input address fields, which may include valid data accidentally entered in the wrong field, or that was lacking its own input field (e.g., e-mail address in an input address field deleted from the output valid mailing address).

And some reporting processes intentionally filter out “bad records” or eliminate “outlier values.”  This happens most frequently when preparing highly summarized reports, especially those intended for executive management.

These are just a few examples of the Dark Side of Data Cleansing, which can turn Ugly Data into Cute Information.


Has your Data Quality turned to the Dark Side?

Like truth, beauty, and singing ability, data quality is in the eyes of the beholder, or since data quality is most commonly defined as fitness for the purpose of use, we could say that data quality is in the eyes of the user.  But how do users know if data is truly fit for their purpose, or if they are simply being presented with information that is aesthetically pleasing for their purpose?

Has your data quality turned to the dark side by turning ugly data into cute information?


Related Posts

Data, Information, and Knowledge Management

Beyond a “Single Version of the Truth”

The Data-Information Continuum

The Circle of Quality

Data Quality and the Cupertino Effect

The Idea of Order in Data

Hell is other people’s data

OCDQ Radio - Organizing for Data Quality

The Reptilian Anti-Data Brain

Amazon’s Data Management Brain

Holistic Data Management (Part 3)

Holistic Data Management (Part 2)

Holistic Data Management (Part 1)

OCDQ Radio - Data Governance Star Wars

Data Governance Star Wars: Bureaucracy versus Agility

The IT Consumerization Conundrum

This blog post is sponsored by the Enterprise CIO Forum and HP.

The consumerization of IT is a disruptive force that many organizations are struggling to come to terms with, especially their IT departments.  As R "Ray" Wang recently blogged about this challenge, “technologies available to consumers at low cost, or even for free, are increasingly pushing aside enterprise applications.  For IT leaders accustomed to having control over corporate technology, this represents a huge challenge — and it’s one they’re not meeting very well.”

Speed and agility are the most common business drivers for implementing new technology.  The consumer technology trifecta of cloud computingSaaS, and mobility has enabled business users to directly purchase off-premises applications that quickly provide only the features they currently need.  Meanwhile, on-premises applications, although feature-rich, become user-poor because of their slower time to implement, and less-than-agile reputation for dealing with change requests and customizations.

However, the organization still relies on some of the functionality, and especially the data, provided by legacy applications, which IT is required to continue to support.  IT is also responsible for assisting the organization with any technology challenges encountered when using modern applications.  This feature fracture (i.e., the technology supporting business needs being splintered across legacy and modern applications) often leaves IT departments overburdened, and causes them to battle against the disruptive force of business-driven consumer technology.

“IT and business leaders need to work together and operate in parallel,” Wang concludes.  “If IT slows down the business capability to innovate, then the company will suffer as new business models emerge and infrastructure will fail to keep up.  If business moves ahead of IT in technology, then the company fails because IT will spend years cleaning up technology messes.”

This is the IT Consumerization Conundrum.  Although, in the short-term, it usually better services the technology needs of the organization, in the long-term, if it’s not properly managed and integrated into the IT Delivery strategy of the organization, then it can create a complex web of technology that entangles the organization much more than it enables it.

Or to borrow the words of Ralph Loura, it can “cause technology to become a business disabler instead of a business enabler.”

This blog post is sponsored by the Enterprise CIO Forum and HP.


Related Posts

The IT Prime Directive of Business First Contact

A Sadie Hawkins Dance of Business Transformation

Are Applications the La Brea Tar Pits for Data?

Why does the sun never set on legacy applications?

The Partly Cloudy CIO

The IT Pendulum and the Federated Future of IT

Suburban Flight, Technology Sprawl, and Garage IT

Organizing for Data Quality

OCDQ Radio is a vendor-neutral podcast about data quality and its related disciplines, produced and hosted by Jim Harris.

Dr. Thomas C. Redman (the “Data Doc”) is an innovator, advisor and teacher.  He was first to extend quality principles to data and information in the late 80s.  Since then he has crystallized a body of tools, techniques, roadmaps and organizational insights that help organizations make order-of-magnitude improvements.

More recently Tom has developed keen insights into the nature of data and formulated the first comprehensive approach to “putting data to work.”  Taken together, these enable organizations to treat data as assets of virtually unlimited potential.

Tom has personally helped dozens of leaders and organizations better understand data and data quality and start their data programs.  He is a sought-after lecturer and the author of dozens of papers and four books.  The most recent, Data Driven: Profiting from Your Most Important Business Asset (Harvard Business Press, 2008) was a Library Journal best buy of 2008.

Prior to forming Navesink Consulting Group in 1996, Tom conceived the Data Quality Lab at AT&T Bell Laboratories in 1987 and led it until 1995.  Tom holds a Ph.D. in statistics from Florida State University.  He holds two patents.

On this episode of OCDQ Radio, Tom Redman and I discuss concepts from his Data Governance and Information Quality 2011 post-conference tutorial about organizing for data quality, which includes his call to action for your role in the data revolution.

Popular OCDQ Radio Episodes

Clicking on the link will take you to the episode’s blog post:

  • Demystifying Data Science — Guest Melinda Thielbar, a Ph.D. Statistician, discusses what a data scientist does and provides a straightforward explanation of key concepts such as signal-to-noise ratio, uncertainty, and correlation.
  • Data Quality and Big Data — Guest Tom Redman (aka the “Data Doc”) discusses Data Quality and Big Data, including if data quality matters less in larger data sets, and if statistical outliers represent business insights or data quality issues.
  • Demystifying Master Data Management — Guest John Owens explains the three types of data (Transaction, Domain, Master), the four master data entities (Party, Product, Location, Asset), and the Party-Role Relationship, which is where we find many of the terms commonly used to describe the Party master data entity (e.g., Customer, Supplier, Employee).
  • Data Governance Star Wars — Special Guests Rob Karel and Gwen Thomas joined this extended, and Star Wars themed, discussion about how to balance bureaucracy and business agility during the execution of data governance programs.
  • The Johari Window of Data Quality — Guest Martin Doyle discusses helping people better understand their data and assess its business impacts, not just the negative impacts of bad data quality, but also the positive impacts of good data quality.
  • Studying Data Quality — Guest Gordon Hamilton discusses the key concepts from recommended data quality books, including those which he has implemented in his career as a data quality practitioner.

Data, Information, and Knowledge Management

The difference, and relationship, between data and information is a common debate.  Not only do these two terms have varying definitions, but they are often used interchangeably.  Just a few examples include comparing and contrasting data quality with information quality, data management with information management, and data governance with information governance.

In a previous blog post, I referenced the Information Hierarchy provided by Professor Ray R. Larson of the School of Information at the University of California, Berkeley:

  • Data – The raw material of information
  • Information – Data organized and presented by someone
  • Knowledge – Information read, heard, or seen, and understood
  • Wisdom – Distilled and integrated knowledge and understanding

Some consider this an esoteric debate between data geeks and information nerds, but what is not debated is the importance of understanding how organizations use data and/or information to support their business activities.  Of particular interest is the organization’s journey from data to decision, the latter of which is usually considered the primary focus of business intelligence.

In his recent blog post, Scott Andrews explained what he called The Information Continuum:

  • Data – A Fact or a piece of information, or a series thereof
  • Information – Knowledge discerned from data
  • Business Intelligence – Information Management pertaining to an organization’s policy or decision-making, particularly when tied to strategic or operational objectives


Knowledge Management

Data Cake
Image by EpicGraphic

This recent graphic does a great job of visualizing the difference between data and information, as well as the importance of how information is presented.  Although the depiction of knowledge as consumed information is oversimplified, I am not sure how this particular visual metaphor could properly represent knowledge as actually understanding the consumed information.

It’s been awhile since the term knowledge management was in vogue within the data management industry. When I began my career, in the early 1990s, I remember hearing about knowledge management as often as we hear about data governance today, which, as you know, is quite often.  The reason I have resurrected the term in this blog post is because I can’t help but wonder if the debate about data and information obfuscates the fact that the organization’s appetite, its business hunger, is for knowledge.


Three Questions for You

  1. Does your organization make a practical distinction between data and information?
  2. If so, how does this distinction affect your quality, management, and governance initiatives?
  3. What is the relationship between those initiatives and your business intelligence efforts?


Please share your thoughts and experiences by posting a comment below.


Related Posts

The Real Data Value is Business Insight

Is your data complete and accurate, but useless to your business?

Data In, Decision Out

The Data-Decision Symphony

Data Confabulation in Business Intelligence

Thaler’s Apples and Data Quality Oranges

DQ-View: Baseball and Data Quality

Beyond a “Single Version of the Truth”

The Business versus IT—Tear down this wall!

Finding Data Quality

Fantasy League Data Quality

The Circle of Quality

The Age of the Platform

OCDQ Radio is a vendor-neutral podcast about data quality and its related disciplines, produced and hosted by Jim Harris.

Phil Simon is the author of three books: The New Small (Motion, 2010), Why New Systems Fail (Cengage, 2010) and The Next Wave of Technologies (John Wiley & Sons, 2010).

A recognized technology expert, he consults companies on how to optimize their use of technology.  His contributions have been featured on The Globe and Mail, the American Express Open Forum, ComputerWorld, ZDNet, abcnews.com, forbes.com, The New York Times, ReadWriteWeb, and many other sites.

When not fiddling with computers, hosting podcasts, putting himself in comics, and writing, Phil enjoys English Bulldogs, tennis, golf, movies that hurt the brain, fantasy football, and progressive rock—which is also the subject of this episode’s book contest (see below).

On this episode of OCDQ Radio, Phil and I discuss his fourth book, The Age of the Platform, which will be published later this year thanks to the help of the generous contributions of people like you who are backing the book’s Kickstarter project.

Popular OCDQ Radio Episodes

Clicking on the link will take you to the episode’s blog post:

  • Demystifying Data Science — Guest Melinda Thielbar, a Ph.D. Statistician, discusses what a data scientist does and provides a straightforward explanation of key concepts such as signal-to-noise ratio, uncertainty, and correlation.
  • Data Quality and Big Data — Guest Tom Redman (aka the “Data Doc”) discusses Data Quality and Big Data, including if data quality matters less in larger data sets, and if statistical outliers represent business insights or data quality issues.
  • Demystifying Master Data Management — Guest John Owens explains the three types of data (Transaction, Domain, Master), the four master data entities (Party, Product, Location, Asset), and the Party-Role Relationship, which is where we find many of the terms commonly used to describe the Party master data entity (e.g., Customer, Supplier, Employee).
  • Data Governance Star Wars — Special Guests Rob Karel and Gwen Thomas joined this extended, and Star Wars themed, discussion about how to balance bureaucracy and business agility during the execution of data governance programs.
  • The Johari Window of Data Quality — Guest Martin Doyle discusses helping people better understand their data and assess its business impacts, not just the negative impacts of bad data quality, but also the positive impacts of good data quality.
  • Studying Data Quality — Guest Gordon Hamilton discusses the key concepts from recommended data quality books, including those which he has implemented in his career as a data quality practitioner.

Data Quality Mischief Managed

Even if you are not a fan of Harry Potter (i.e., you’re a Muggle who hasn’t either read the books or at least seen the movies), you’re probably aware the film franchise concludes this summer.

As I have discussed in my blog post Data Quality Magic, data quality tools are not magic in and of themselves, but like the wands in the wizarding world of Harry Potter, they channel the personal magic force of the wizards or witches who wield them.  In other words, the magic in the wizarding world of data quality comes from the people working on data quality initiatives.

Extending the analogy, data quality methodology is like the books of spells and potions in Harry Potter, which are also not magic in and of themselves, but again require people through which to channel their magical potential.  And the importance of having people who are united by trust, cooperation, and collaboration is the data quality version of the Order of the Phoenix, with the Data Geeks battling against the Data Eaters (i.e., the dark wizards, witches, spells, and potions that are perpetuating the plague of poor data quality throughout the organization).

And although data quality doesn’t have a Marauder’s Map (nor does it usually require you to recite the oath: “I solemnly swear that I am up to no good”), sometimes the journey toward getting your organization’s data quality mischief managed feels like you’re on a magical quest.


Related Posts

Data Quality Magic

Data Quality is not a Magic Trick

Do you believe in Magic (Quadrants)?

There are no Magic Beans for Data Quality

The Tooth Fairy of Data Quality

Video: Oh, the Data You’ll Show!

Data Quality and #FollowFriday the 13th

Dilbert, Data Quality, Rabbits, and #FollowFriday

Spartan Data Quality

Pirates of the Computer: The Curse of the Poor Data Quality

The Tell-Tale Data

Data Quality is People!

Commendable Comments (Part 10)

Welcome to the 300th Obsessive-Compulsive Data Quality (OCDQ) blog post!

You might have been expecting a blog post inspired by the movie 300, but since I already did that with Spartan Data Quality, instead I decided to commemorate this milestone with the 10th entry in my ongoing series for expressing my gratitude to my readers for their truly commendable comments on my blog posts.


Commendable Comments

On DQ-BE: Single Version of the Time, Vish Agashe commented:

“This has been one of my pet peeves for a long time. Shared version of truth or the reference version of truth is so much better, friendly and non-dictative (if such a word exists) than single version of truth.

I truly believe that starting a discussion with Single Version of the Truth with business stakeholders is a nonstarter. There will always be a need for multifaceted view and possibly multiple aspects of the truth.

A very common term/example I have come across is the usage of the term revenue. Unfortunately, there is no single version of revenue across the organizations (and for valid reasons). From Sales Management prospective, they like to look at sales revenue (sales bookings) which is the business on which they are compensated on, financial folks want to look at financial revenue, which is the revenue they capture in the books and marketing possibly wants to look at marketing revenue (sales revenue before the discount) which is the revenue marketing uses to justify their budgets. So if you ever asked questions to a group of people about what revenue of the organization is, you will get three different perspectives. And these three answers will be accurate in the context of three different groups.”

On Data Confabulation in Business Intelligence, Henrik Liliendahl Sørensen commented:

“I think this is going to dominate the data management realm in the coming years. We are not only met with drastically increasing volumes of data, but also increasing velocity and variety of data.

The dilemma is between making good decisions and making fast decisions, whether the decisions based on business intelligence findings should wait for assuring the quality of the data upon which the decisions are made, thus risking the decision being too late. If data quality always could be optimal by being solved at the root we wouldn’t have that dilemma.

The challenge is if we are able to have optimal data all the time when dealing with extreme data, which is data of great variety moving in high velocity and coming in huge volumes.”

On The People Platform, Mark Allen commented:

“I definitely agree and think you are burrowing into the real core of what makes or breaks EDM and MDM type initiatives -- it's the people.

Business models, processes, data, and technology all provide fixed forms of enablement or constraint. And where in the past these dynamics have been very compartmentalized throughout a company's business model and systems architecture, with EDM and MDM involving more integrated functions and shared data, people become more of the x-factor in the equation. This demands the presence of data governance to be the facilitating process that drives the collaborative, cross-functional, and decision making dynamics needed for successful EDM and MDM. Of course, the dilemma is that in a governance model people can still make bad decisions that inhibit people from working effectively.

So in terms of the people platform and data governance, there needs to be the correct focus on what are the right roles and good decisions made that can enable people to interact effectively.”

On Beware the Data Governance Ides of March, Jill Wanless commented:

“Our organization has taken the Hybrid Approach (starting Bottom-Up) and it works well for two reasons: (1) the worker bee rock stars are all aligned and ready to hit the ground running, and (2) the ‘Top’ can sit back and let the ‘aligned’ worker bees get on with it.

Of course, this approach is sometimes (painfully) slow, but with the ground-level rock stars already aligned, there is less resistance implementing the policies, and the Top’s heavy hand is needed much less frequently, but I voted for Hybrid Approach (starting Top-Down) because I have less than stellar patience for the long and scenic route.”

On Data Governance and the Buttered Cat Paradox, Rob Drysdale commented:

“Too many companies get paralyzed thinking about how to do this and implement it. (Along with the overwhelmed feeling that it is too much time/effort/money to fix it.) But I think your poll needs another option to vote on, specifically: ‘Whatever works for the company/culture/organization’ since not all solutions will work for every organization.

In some where it is highly structured, rigid and controlled, there wouldn’t be the freedom at the grass-roots level to start something like this and it might be frowned upon by upper-level management. In other organizations that foster grass-roots things then it could work.

However, no matter which way you can get it started and working, you need to have buy-in and commitment at all levels to keep it going and make it effective.”

On The Data Quality Wager, Gordon Hamilton commented:

“Deming puts a lot of energy into his arguments in 'Out of the Crisis' that the short-term mindset of the executives, and by extension the directors, is a large part of the problem.

Jackanapes, a lovely under-used term, might be a bit strong when the executives are really just doing what they are paid for. In North America we get what the directors measure! In fact, one quandary is that a proactive executive, who invests in data quality is building the long-term value of their company but is also setting it up to be acquired by somebody who recognizes that the 'under the radar' improvements are making the prize valuable.

Deming says on p.100: 'Fear of unfriendly takeover may be the single most important obstacle to constancy of purpose. There is also, besides the unfriendly takeover, the equally devastating leveraged buyout. Either way, the conqueror demands dividends, with vicious consequences on the vanquished.'”

On Got Data Quality?, Graham Rhind commented:

“It always makes me smile when people attempt to put a percentage value on their data quality as though it were something as tangible and measurable as the fat content of your milk.

In order to make such a measurement one would need to know where 100% of the defects lie. If they knew that they would be able to resolve the defects and achieve 100% quality. In reality you cannot and do not know where each defect is and how many there are.

Even though tools such as profilers will tell you, for example, that 95% of your US address records have a valid state added, there is still no way to measure how many of these valid states are applicable to the real world entity on the ground. Mr Smith may be registered in the database to an existing and valid address in the database, but if he moved last week there's a data quality issue that won't be discovered until one attempts to contact him.

The same applies when people say they have removed 95% of duplicates from their data. If they can measure it then they know where the other 5% of duplicates are and they can remove them.

But back to the point: you may not achieve 100% quality. In fact, we know you never will. But aiming for that target means that you're aiming in the right direction. As long as your goal is to get close to perfection and not to achieve it, I don't see the problem.”

On Data Governance Star Wars: Balancing Bureaucracy and Agility, Rob “Darth” Karel commented:

“A curious question to my Rebellious friend OCDQ-Wan, while data governance agility is a wonderful goal, and maybe a great place to start your efforts, is it sustainable?

Your agile Rebellion is like any start-up: decisions must be made quickly, you must do a lot with limited resources, everyone plays multiple roles willingly, and your objective is very targeted and specific. For example, to fire a photon torpedo into a small thermal exhaust port - only 2 meters wide - connected directly to the main reactor of the Death Star. Let's say you 'win' that market objective. What next?

The Rebellion defeats the Galactic Empire, leaving a market leadership vacuum. The Rebellion begins to set up a new form of government to serve all (aka grow existing market and expand into new markets) and must grow larger, with more layers of management, in order to scale. (aka enterprise data governance supporting all LOBs, geographies, and business functions).

At some point this Rebellion becomes a new Bureaucracy - maybe with a different name and legacy, but with similar results. Don't forget, the Galactic Empire started as a mini-rebellion itself spearheaded by the agile Palpatine!” 

You Are Awesome

Thank you very much for sharing your perspectives with our collablogaunity.  This entry in the series highlighted the commendable comments received on OCDQ Blog posts published between January and June of 2011.

Since there have been so many commendable comments, please don’t be offended if one of your comments wasn’t featured.

Please keep on commenting and stay tuned for future entries in the series.

By the way, even if you have never posted a comment on my blog, you are still awesome — feel free to tell everyone I said so.

Thank you for reading the Obsessive-Compulsive Data Quality (OCDQ) blog.  Your readership is deeply appreciated.


Related Posts

730 Days and 264 Blog Posts Later – The Second Blogiversary of OCDQ Blog

OCDQ Blog Bicentennial – The 200th OCDQ Blog Post

Commendable Comments (Part 9)

Commendable Comments (Part 8)

Commendable Comments (Part 7)

Commendable Comments (Part 6)

Commendable Comments (Part 5) – The 100th OCDQ Blog Post

Commendable Comments (Part 4)

Commendable Comments (Part 3)

Commendable Comments (Part 2)

Commendable Comments (Part 1)

Social Media Strategy

OCDQ Radio is a vendor-neutral podcast about data quality and its related disciplines, produced and hosted by Jim Harris.

Effectively using social media within a business context is more art than science, which is why properly planning and executing a social media strategy is essential for organizations as well as individual professionals.

On this episode, I discuss social media strategy and content marketing with Crysta Anderson, a Social Media Strategist for IBM, who manages IBM InfoSphere’s social media presence, including the Mastering Data Management blog, the @IBMInitiate and @IBM_InfoSphere Twitter accounts, LinkedIn and other platforms.

Crysta Anderson also serves as a social media subject matter expert for IBM’s Information Management division.

Under Crysta’s execution, IBM Initiate has received numerous social media awards, including “Best Corporate Blog” from the Chicago Business Marketing Association, Marketing Sherpa’s 2010 Viral and Social Marketing Hall of Fame, and BtoB Magazine’s list of “Most Successful Online Social Networking Initiatives.”

Crysta graduated from the University of Chicago with a BA in Political Science and is currently pursuing a Master’s in Integrated Marketing Communications at Northwestern University’s Medill School.  Learn more about Crysta Anderson on LinkedIn.

Popular OCDQ Radio Episodes

Clicking on the link will take you to the episode’s blog post:

  • Demystifying Data Science — Guest Melinda Thielbar, a Ph.D. Statistician, discusses what a data scientist does and provides a straightforward explanation of key concepts such as signal-to-noise ratio, uncertainty, and correlation.
  • Data Quality and Big Data — Guest Tom Redman (aka the “Data Doc”) discusses Data Quality and Big Data, including if data quality matters less in larger data sets, and if statistical outliers represent business insights or data quality issues.
  • Demystifying Master Data Management — Guest John Owens explains the three types of data (Transaction, Domain, Master), the four master data entities (Party, Product, Location, Asset), and the Party-Role Relationship, which is where we find many of the terms commonly used to describe the Party master data entity (e.g., Customer, Supplier, Employee).
  • Data Governance Star Wars — Special Guests Rob Karel and Gwen Thomas joined this extended, and Star Wars themed, discussion about how to balance bureaucracy and business agility during the execution of data governance programs.
  • The Johari Window of Data Quality — Guest Martin Doyle discusses helping people better understand their data and assess its business impacts, not just the negative impacts of bad data quality, but also the positive impacts of good data quality.
  • Studying Data Quality — Guest Gordon Hamilton discusses the key concepts from recommended data quality books, including those which he has implemented in his career as a data quality practitioner.

The Stakeholder’s Dilemma

Game theory models a strategic situation as a game in which an individual player’s success depends on the choices made by the other players involved in the game.  One excellent example is the game known as The Prisoner’s Dilemma, which is deliberately designed to demonstrate why two people might not cooperate—even if it is in both of their best interests to do so.

Here is the classic scenario.  Two criminal suspects are arrested, but the police have insufficient evidence for a conviction.  So they separate the prisoners and offer each the same deal.  If one testifies for the prosecution against the other (i.e., defects) and the other remains silent (i.e., cooperates), the defector goes free and the silent accomplice receives the full one-year sentence.  If both remain silent, both prisoners are sentenced to only one month in jail for a minor charge.  If each betrays the other, each receives a three-month sentence.  Each prisoner must choose to betray the other or to remain silent.

If you have ever regularly watched a police procedural television series, such as Law & Order, then you have seen many dramatizations of the prisoner’s dilemma, including several sample outcomes of when the prisoners make different choices.

The Iterated Prisoner’s Dilemma

In iterated versions of the prisoner’s dilemma, players remember the previous actions of their opponent and change their strategy accordingly.  In many fields of study, these variations are considered fundamental to understanding cooperation and trust.

Here is an economics scenario with two players and a banker.  Each player holds a set of two cards, one printed with the word Cooperate (as in, with each other), the other printed with the word Defect.  Each player puts one card face-down in front of the banker.  By laying them face down, the possibility of a player knowing the other player’s selection in advance is eliminated.  At the end of each turn, the banker turns over both cards and gives out the payments, which can vary, but one example is as follows.

If both players cooperate, they are each awarded $5.  If both players defect, they are each penalized $1.  But if one player defects while the other player cooperates, the defector is awarded $10, while the cooperator neither wins nor loses any money.

Therefore, the safest play is to always cooperate, since you would never lose any money—and if your opponent always cooperates, then you can both win on every turn.  However, although defecting creates the possibility of losing a small amount of money, it also creates the possibility of winning twice as much money.

It is the iterated nature of this version of the prisoner’s dilemma that makes it so interesting for those studying human behavior.

For example, if you were playing against me, and I defected on the first two turns while you cooperated, I would have won $20 while you would have won nothing.  So what would you do on the third turn?  Let’s say that you choose to defect.

But if I defected yet again, although we would both lose $1, overall I would still be +$19 while you would be -$1.  And what if I continued defecting?  This would actually be an understandable strategy for me—if I was only playing for money, since you would have to defect 19 more times in a row before I broke even, but by which time you would have also lost $20.  And if instead, you start cooperating again in order to stop your losses, I could win a lot of money—at the expense of losing your trust.

Although the iterated prisoner’s dilemma is designed so that, over the long-term, cooperating players generally do better than non-cooperating players, in the short-term, the best result for an individual player is to defect while their opponent cooperates.

The Stakeholder’s Dilemma

Organizations embarking on an enterprise-wide initiative, such as data quality, master data management, and data governance, play a version of the iterated prisoner’s dilemma, which I refer to as The Stakeholder’s Dilemma.

These initiatives often bring together key stakeholders from all around the organization, representing each business unit or business function, and perhaps stakeholders representing data and technology as well.  These stakeholders usually form a committee or council, which is responsible for certain top-down aspects of the initiative, such as funding and strategic planning.

Of course, it is unrealistic to expect every stakeholder to cooperate equally at all times.  The realities of the fiscal calendar effect, conflicting interests, and changing business priorities, will mean that during any particular turn in the game (i.e., the current phase of the initiative), the amount of resources (money, time, people) allocated to the effort by a particular stakeholder will vary.

There will be times when sacrifices for the long-term greater good of the initiative will require that cooperating stakeholders either contribute more resources during the current phase, or receive fewer benefits from its deliverables, than defecting stakeholders.

As with the iterated prisoner’s dilemma, the challenge is what happens during the next turn (i.e., the next phase of the initiative).

If the same stakeholders repeatedly defect, then will the other stakeholders continue to cooperate?  Or will the spirit of trust, cooperation, and collaboration necessary for the continuing success of the ongoing initiative be irreparably damaged?

There are many, and often complex, reasons for why enterprise-wide initiatives fail, but failing to play the stakeholder’s dilemma well is one very common reason—and it is also a reason why many future enterprise-wide initiatives will fail to garner support.

How well does your organization play The Stakeholder’s Dilemma?

Related Posts

Data Profiling Early and Often

OCDQ Radio is a vendor-neutral podcast about data quality and its related disciplines, produced and hosted by Jim Harris.

On this episode of OCDQ Radio, I discuss data profiling with James Standen, the founder and CEO of nModal Solutions Inc., the makers of Datamartist, which is a fast, easy to use, visual data profiling and transformation tool.

Before founding nModal, James had over 15 years experience in a broad range of roles involving data, ranging from building business intelligence solutions, creating data warehouses and a data warehouse competency center, through to working on data migration and ERP projects in large organizations.  You can learn more about and connect with James Standen on LinkedIn.

James thinks that while there is obviously good data and bad data, that often bad data is just misunderstood and can be coaxed away from the dark side if you know how to approach it.  He does recommend wearing the proper safety equipment however, and having the right tools.  For more of his wit and wisdom, follow Datamartist on Twitter, and read the Datamartist Blog.

Popular OCDQ Radio Episodes

Clicking on the link will take you to the episode’s blog post:

  • Demystifying Data Science — Guest Melinda Thielbar, a Ph.D. Statistician, discusses what a data scientist does and provides a straightforward explanation of key concepts such as signal-to-noise ratio, uncertainty, and correlation.
  • Data Quality and Big Data — Guest Tom Redman (aka the “Data Doc”) discusses Data Quality and Big Data, including if data quality matters less in larger data sets, and if statistical outliers represent business insights or data quality issues.
  • Demystifying Master Data Management — Guest John Owens explains the three types of data (Transaction, Domain, Master), the four master data entities (Party, Product, Location, Asset), and the Party-Role Relationship, which is where we find many of the terms commonly used to describe the Party master data entity (e.g., Customer, Supplier, Employee).
  • Data Governance Star Wars — Special Guests Rob Karel and Gwen Thomas joined this extended, and Star Wars themed, discussion about how to balance bureaucracy and business agility during the execution of data governance programs.
  • The Johari Window of Data Quality — Guest Martin Doyle discusses helping people better understand their data and assess its business impacts, not just the negative impacts of bad data quality, but also the positive impacts of good data quality.
  • Studying Data Quality — Guest Gordon Hamilton discusses the key concepts from recommended data quality books, including those which he has implemented in his career as a data quality practitioner.

Data Governance and Information Quality 2011

Last week, I attended the Data Governance and Information Quality 2011 Conference, which was held June 27-30 in San Diego, California at the Catamaran Resort Hotel and Spa.

In this blog post, I summarize a few of the key points from some of the sessions I attended.  I used Twitter to help me collect my notes, and you can access the complete archive of my conference tweets on Twapper Keeper.


Assessing Data Quality Maturity

In his pre-conference tutorial, David Loshin, author of the book The Practitioner’s Guide to Data Quality Improvement, described five stages comprising a continuous cycle of data quality improvement:

  1. Identify and measure how poor data quality impedes business objectives
  2. Define business-related data quality rules and performance targets
  3. Design data quality improvement processes that remediate business process flaws
  4. Implement data quality improvement methods
  5. Monitor data quality against targets


Getting Started with Data Governance

Oliver Claude from Informatica provided some tips for making data governance a reality:

  • Data Governance requires acknowledging People, Process, and Technology are interlinked
  • You need to embed your data governance policies into your operational business processes
  • Data Governance must be Business-Centric, Technology-Enabled, and Business/IT Aligned


Data Profiling: An Information Quality Fundamental

Danette McGilvray, author of the book Executing Data Quality Projects, shared some of her data quality insights:

  • Although the right technology is essential, data quality is more than just technology
  • Believing tools cause good data quality is like believing X-Ray machines cause good health
  • Data Profiling is like CSI — Investigating the Poor Data Quality Crime Scene


Building Data Governance and Instilling Data Quality

In the opening keynote address, Dan Hartley of ConAgra Foods shared his data governance and data quality experiences:

  • It is important to realize that data governance is a journey, not a destination
  • One of the commonly overlooked costs of data governance is the cost of inaction
  • Data governance must follow a business-aligned and business-value-driven approach
  • Data governance is as much about change management as it is anything else
  • Data governance controls must be carefully balanced so they don’t disrupt business processes
  • Common Data Governance Challenge: Balancing Data Quality and Speed (i.e., Business Agility)
  • Common Data Governance Challenge: Picking up Fumbles — Balls dropped between vertical organizational silos
  • Bad business processes cause poor data quality
  • Better Data Quality = A Better Bottom Line
  • One of the most important aspects of Data Governance and Data Quality — Wave the Flag of Success


Practical Data Governance

Winston Chen from Kalido discussed some aspects of delivering tangible value with data governance:

  • Data governance is the business process of defining, implementing, and enforcing data policies
  • Every business process can be improved by feeding it better data
  • Data Governance is the Horse, not the Cart, i.e., Data Governance drives MDM and Data Quality
  • Data Governance needs to balance Data Silos (Local Authority) and Data Cathedrals (Central Control)


The Future of Data Governance and Data Quality

The closing keynote panel, moderated by Danette McGilvray, included the following insights:

  • David Plotkin: “It is not about Data, Process, or Technology — It is about People”
  • John Talburt: “For every byte of Data, we need 1,000 bytes of Metadata to go along with it”
  • C. Lwanga Yonke: “One of the most essential skills is the ability to lead change”
  • John Talburt: “We need to be focused on business-value-based data governance and data quality”
  • C. Lwanga Yonke: “We must be multilingual: Speak Data/Information, Business, and Technology”


Organizing for Data Quality

In his post-conference tutorial, Tom Redman, author of the book Data Driven, described ten habits of those with the best data:

  1. Focus on the most important needs of the most important customers
  2. Apply relentless attention to process
  3. Manage all critical sources of data, including external suppliers
  4. Measure data quality at the source and in business terms
  5. Employ controls at all levels to halt simple errors and establish a basis for moving forward
  6. Develop a knack for continuous improvement
  7. Set and achieve aggressive targets for improvement
  8. Formalize management accountabilities for data
  9. Lead the effort using a broad, senior group
  10. Recognize that the hard data quality issues are soft and actively manage the needed cultural changes


Tweeps Out at the Ball Game

As I mentioned earlier, I used Twitter to help me collect my notes, and you can access the complete archive of my conference tweets on Twapper Keeper.

But I wasn’t the only data governance and data quality tweep at the conference.  Steve Sarsfield, April Reeve, and Joe Dos Santos were also attending and tweeting.

However, on Tuesday night, we decided to take a timeout from tweeting, and instead became Tweeps out at the Ball Game by attending the San Diego Padres and Kansas Royals baseball game at PETCO Park.

We sang Take Me Out to the Ball Game, bought some peanuts and Cracker Jack, and root, root, rooted for the home team, which apparently worked since Padres closer Heath Bell got one, two, three strikes, you’re out on Royals third baseman Wilson Betemit, and the San Diego Padres won the game by a final score of 4-2.

So just like at the Data Governance and Information Quality 2011 Conference, a good time was had by all.  See you next year!


Related Posts

Stuck in the Middle with Data Governance

DQ-BE: Invitation to Duplication

TDWI World Conference Orlando 2010

Light Bulb Moments at DataFlux IDEAS 2010

Enterprise Data World 2010

Enterprise Data World 2009

TDWI World Conference Chicago 2009

DataFlux IDEAS 2009

Data Governance Star Wars

OCDQ Radio is a vendor-neutral podcast about data quality and its related disciplines, produced and hosted by Jim Harris.

WindowsLiveWriter-DataGovernanceStarWars_728F-

Shown above is the poll results from the recent Star Wars themed blog debate about one of data governance’s biggest challenges, how to balance bureaucracy and business agility.  Rob Karel took the position for Bureaucracy as Darth Karel of the Empire, and I took the position for Agility as OCDQ-Wan Harris of the Rebellion.

However, this was a true debate format where Rob and I intentionally argued polar opposite positions with full knowledge that the reality is data governance success requires effectively balancing bureaucracy and business agility.

Just in case you missed the blog debate, here are the post links:

On this special, extended, and Star Wars themed episode of OCDQ Radio, I am joined by Rob Karel and Gwen Thomas to discuss this common challenge of effectively balancing bureaucracy and business agility on data governance programs.

Rob Karel is a Principal Analyst at Forrester Research, where he serves Business Process and Applications Professionals.  Rob is a leading expert in how companies manage data and integrate information across the enterprise.  His current research focus includes process data management, master data management, data quality management, metadata management, data governance, and data integration technologies.  Rob has more than 19 years of data management experience, working in both business and IT roles to develop solutions that provide better quality, confidence in, and usability of critical enterprise data.

Gwen Thomas is the Founder and President of The Data Governance Institute, a vendor-neutral, mission-based organization with three arms: publishing free frameworks and guidance, supporting communities of practitioners, and offering training and consulting.  Gwen also writes the popular blog Data Governance Matters, frequently contributes to IT and business publications, and is the author of the book Alpha Males and Data Disasters: The Case for Data Governance.

This extended episode of OCDQ Radio is 49 minutes long, and is divided into two parts, which are separated by a brief Star Wars themed intermission.  In Part 1, Rob and I discuss our blog debate.  In Part 2, Gwen joins us to provide her excellent insights.

Popular OCDQ Radio Episodes

Clicking on the link will take you to the episode’s blog post:

  • Demystifying Data Science — Guest Melinda Thielbar, a Ph.D. Statistician, discusses what a data scientist does and provides a straightforward explanation of key concepts such as signal-to-noise ratio, uncertainty, and correlation.
  • Data Quality and Big Data — Guest Tom Redman (aka the “Data Doc”) discusses Data Quality and Big Data, including if data quality matters less in larger data sets, and if statistical outliers represent business insights or data quality issues.
  • Demystifying Master Data Management — Guest John Owens explains the three types of data (Transaction, Domain, Master), the four master data entities (Party, Product, Location, Asset), and the Party-Role Relationship, which is where we find many of the terms commonly used to describe the Party master data entity (e.g., Customer, Supplier, Employee).
  • The Johari Window of Data Quality — Guest Martin Doyle discusses helping people better understand their data and assess its business impacts, not just the negative impacts of bad data quality, but also the positive impacts of good data quality.
  • Studying Data Quality — Guest Gordon Hamilton discusses the key concepts from recommended data quality books, including those which he has implemented in his career as a data quality practitioner.

Stuck in the Middle with Data Governance

Perhaps the most common debate about data governance is whether it should be started from the top down or the bottom up.

Data governance requires the coordination of a complex combination of a myriad of factors, including executive sponsorship, funding, decision rights, arbitration of conflicting priorities, policy definition, policy implementation, data quality remediation, data stewardship, business process optimization, technology, policy enforcement—and obviously many other factors as well.

This common debate is understandable since some of these data governance success factors are mostly top-down (e.g., funding), and some of these data governance success factors are mostly bottom-up (e.g., data quality remediation and data stewardship).

However, the complexity that stymies many organizations is most data governance success factors are somewhere in the middle.


Stuck in the Middle with Data Governance

At certain times during the evolution of a data governance program, top-down aspects will be emphasized, and at other times, bottom-up aspects will be emphasized.  So whether you start from the top down or the bottom up, eventually you are going to need to blend together top-down and bottom-up aspects in order to sustain an ongoing and pervasive data governance program.

To paraphrase The Beatles, when you get to the bottom, you go back to the top, where you stop and turn, and you go for a ride until you get to the bottom—and then you do it again.  (But hopefully your program doesn’t get code-named: “Helter Skelter”)

But after some initial progress has been made, to paraphrase Stealers Wheel, people within the organization may start to feel like we have top-down to the left of us, bottom-up to the right to us, and here we are—stuck in the middle with data governance.

In other words, although data governance is never a direct current only flowing in one top-down or bottom-up direction, but instead continually flows in an alternating current between top-down and bottom-up, when this dynamic is not communicated to everyone throughout the organization, progress is disrupted by people waiting around for someone else to complete the circuit.

But when, paraphrasing Pearl Jam, data governance is taken up by the middle—then there ain’t gonna be any middle any more.

In other words, when data governance pervades every level of the organization, everyone stops thinking in terms of top-down and bottom-up, and acts like an enterprise in the midst of sustaining the momentum of a successful data governance program.


Data Governance Conference

DGIQ Event Button

Next week, I will be attending the Data Governance and Information Quality Conference, which will be held June 27-30 in San Diego, California at the Catamaran Resort Hotel and Spa.

If you will also be attending, and you want to schedule a meeting with me: Contact me via email

If you will not be attending, you can follow the conference tweets using the hashtag: #DGIQ2011


Related Posts

Data Governance Star Wars: Balancing Bureaucracy And Agility

Council Data Governance

DQ-View: Roman Ruts on the Road to Data Governance

The Data Governance Oratorio

Zig-Zag-Diagonal Data Governance

Data Governance and the Buttered Cat Paradox

Beware the Data Governance Ides of March

A Tale of Two G’s

The People Platform

Rise of the Datechnibus

The Collaborative Culture of Data Governance

Connect Four and Data Governance

The Role Of Data Quality Monitoring In Data Governance

Quality and Governance are Beyond the Data

Data Transcendentalism

Podcast: Data Governance is Mission Possible

Video: Declaration of Data Governance

Don’t Do Less Bad; Do Better Good

Jack Bauer and Enforcing Data Governance Policies

The Prince of Data Governance

MacGyver: Data Governance and Duct Tape

The Diffusion of Data Governance