Plato’s Data

Plato’s Cave is a famous allegory from philosophy that describes a fictional scenario where people mistake an illusion for reality.

The allegory describes a group of people who have lived their whole lives as prisoners chained motionless in a dark cave, forced to face a blank wall.  Behind the prisoners is a large fire.  In front of the fire are puppeteers that project shadows onto the cave wall, acting out little plays, which include mimicking voices and sound effects that echo off the cave walls.  These shadows and echoes are only projections, partial reflections of a reality created by the puppeteers.  However, this illusion represents the only reality the prisoners have ever known, and so to them the shadows are real sights and the echoes are real sounds.

When one of the prisoners is freed and permitted to turn around and see the source of the shadows and echoes, he rejects reality as an illusion.  The prisoner is then dragged out of the cave into the sunlight, out into the bright, painful light of the real world, which he also rejects as an illusion.  How could these sights and sounds be real to him when all he has ever known is the cave?

But eventually the prisoner acclimates to the real world, realizing that the real illusion was the shadows and echoes in the cave.

Unfortunately, this is when he’s returned to his imprisonment in the cave.  Can you imagine how painful the rest of his life will be, once again being forced to watch the shadows and listen to the echoes — except now he knows that they are not real.

Plato’s Cinema

A modern update on the allegory is something we could call Plato’s Cinema, where a group of people live their whole lives as prisoners chained motionless in a dark cinema, forced to face a blank screen.  Behind the audience is a large movie projector.

Please stop reading for a moment and try to imagine if everything you ever knew was based entirely on the movies you watched.

Now imagine you are one of the prisoners, and you did not get to choose the movies, but instead were forced to watch whatever the projectionist chooses to show you.  Although the fictional characters and stories of these movies are only projections, partial reflections of a reality created by the movie producers, since this illusion would represent the only reality you have ever known, to you the characters would be real people and the stories would be real events.

If you were freed from this cinema prison, permitted to turn around and see the projector, wouldn’t you reject it as an illusion?  If you were dragged out of the cinema into the sunlight, out into the bright, painful light of the real world, wouldn’t you also reject reality as an illusion?  How could these sights and sounds be real to you when all you have ever known is the cinema?

Let’s say that you eventually acclimated to the real world, realizing that the real illusion was the projections on the movie screen.

However, now let’s imagine that you are then returned to your imprisonment in the dark cinema.  Can you imagine how painful the rest of your life would be, once again being forced to watch the movies — except now you know that they are not real.

Plato’s Data

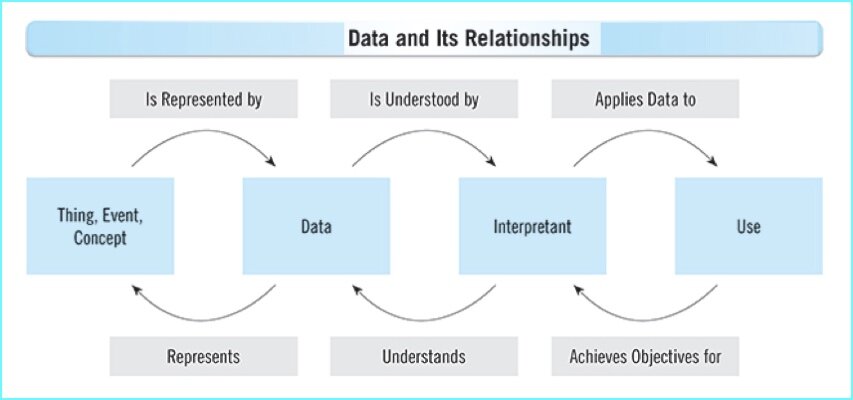
Whether it’s an abstract description of real-world entities (i.e., “master data”) or an abstract description of real-world interactions (i.e., “transaction data”) among entities, data is an abstract description of reality — let’s call this the allegory of Plato’s Data.

We often act as if we are being forced to face our computer screen, upon which data tells us a story about the real world that is just as enticing as the flickering shadows on the wall of Plato’s Cave, or the mesmerizing movies projected in Plato’s Cinema.

Data shapes our perception of the real world, but sometimes we forget that data is only a partial reflection of reality.

I am sure that it sounds silly to point out something so obvious, but imagine if, before you were freed, the other prisoners, in either the cave or the cinema, tried to convince you that the shadows or the movies weren’t real.  Or imagine you’re the prisoner returning to either the cave or the cinema.  How would you convince other prisoners that you’ve seen the true nature of reality?

A common question about Plato’s Cave is whether it’s crueler to show the prisoner the real world, or to return the prisoner to the cave after he has seen it.  Much like the illusions of the cave and the cinema, data makes more sense the more we believe it is real.

However, with data, neither breaking the illusion nor returning ourselves to it is cruel, but is instead a necessary practice because it’s important to occasionally remind ourselves that data and the real world are not the same thing.

Finding Data Quality

WindowsLiveWriter-FindingDataQuality_F0E9-

Have you ever experienced that sinking feeling, where you sense if you don’t find data quality, then data quality will find you?

In the spring of 2003, Pixar Animation Studios produced one of my all-time favorite Walt Disney Pictures—Finding Nemo

This blog post is an hommage to not only the film, but also to the critically important role into which data quality is cast within all of your enterprise information initiatives, including business intelligence, master data management, and data governance. 

I hope that you enjoy reading this blog post, but most important, I hope you always remember: “Data are friends, not food.”

Data Silos

WindowsLiveWriter-FindingDataQuality_F0E9-

“Mine!  Mine!  Mine!  Mine!  Mine!”

That’s the Data Silo Mantra—and it is also the bane of successful enterprise information management.  Many organizations persist on their reliance on vertical data silos, where each and every business unit acts as the custodian of their own private data—thereby maintaining their own version of the truth.

Impressive business growth can cause an organization to become a victim of its own success.  Significant collateral damage can be caused by this success, and most notably to the organization’s burgeoning information architecture.

Earlier in an organization’s history, it usually has fewer systems and easily manageable volumes of data, thereby making managing data quality and effectively delivering the critical information required to make informed business decisions everyday, a relatively easy task where technology can serve business needs well—especially when the business and its needs are small.

However, as the organization grows, it trades effectiveness for efficiency, prioritizing short-term tactics over long-term strategy, and by seeing power in the hoarding of data, not in the sharing of information, the organization chooses business unit autonomy over enterprise-wide collaboration—and without this collaboration, successful enterprise information management is impossible.

A data silo often merely represents a microcosm of an enterprise-wide problem—and this truth is neither convenient nor kind.

Data Profiling

WindowsLiveWriter-FindingDataQuality_F0E9-

“I see a light—I’m feeling good about my data . . .

Good feeling’s gone—AHH!”

Although it’s not exactly a riddle wrapped in a mystery inside an enigma,  understanding your data is essential to using it effectively and improving its quality—to achieve these goals, there is simply no substitute for data analysis.

Data profiling can provide a reality check for the perceptions and assumptions you may have about the quality of your data.  A data profiling tool can help you by automating some of the grunt work needed to begin your analysis.

However, it is important to remember that the analysis itself can not be automated—you need to translate your analysis into the meaningful reports and questions that will facilitate more effective communication and help establish tangible business context.

Ultimately, I believe the goal of data profiling is not to find answers, but instead, to discover the right questions. 

Discovering the right questions requires talking with data’s best friends—its stewards, analysts, and subject matter experts.  These discussions are a critical prerequisite for determining data usage, standards, and the business relevant metrics for measuring and improving data quality.  Always remember that well performed data profiling is highly interactive and a very iterative process.

Defect Prevention

WindowsLiveWriter-FindingDataQuality_F0E9-

“You, Data-Dude, takin’ on the defects.

You’ve got serious data quality issues, dude.

Awesome.”

Even though it is impossible to truly prevent every problem before it happens, proactive defect prevention is a highly recommended data quality best practice because the more control enforced where data originates, the better the overall quality will be for enterprise information.

Although defect prevention is most commonly associated with business and technical process improvements, after identifying the burning root cause of your data defects, you may predictably need to apply some of the principles of behavioral data quality.

In other words, understanding the complex human dynamics often underlying data defects is necessary for developing far more effective tactics and strategies for implementing successful and sustainable data quality improvements.

Data Cleansing

WindowsLiveWriter-FindingDataQuality_F0E9-

“Just keep cleansing.  Just keep cleansing.

Just keep cleansing, cleansing, cleansing.

What do we do?  We cleanse, cleanse.”

That’s not the Data Cleansing Theme Song—but it can sometimes feel like it.  Especially whenever poor data quality negatively impacts decision-critical information, the organization may legitimately prioritize a reactive short-term response, where the only remediation will be fixing the immediate problems.

Balancing the demands of this data triage mentality with the best practice of implementing defect prevention wherever possible, will often create a very challenging situation for you to contend with on an almost daily basis.

Therefore, although comprehensive data remediation will require combining reactive and proactive approaches to data quality, you need to be willing and able to put data cleansing tools to good use whenever necessary.

Communication

WindowsLiveWriter-FindingDataQuality_F0E9-

“It’s like he’s trying to speak to me, I know it.

Look, you’re really cute, but I can’t understand what you’re saying.

Say that data quality thing again.”

I hear this kind of thing all the time (well, not the “you’re really cute” part).

Effective communication improves everyone’s understanding of data quality, establishes a tangible business context, and helps prioritize critical data issues. 

Keep in mind that communication is mostly about listening.  Also, be prepared to face “data denial” when data quality problems are discussed.  Most often, this is a natural self-defense mechanism for the people responsible for business processes, technology, and data—and because of the simple fact that nobody likes to feel blamed for causing or failing to fix the data quality problems.

The key to effective communication is clarity.  You should always make sure that all data quality concepts are clearly defined and in a language that everyone can understand.  I am not just talking about translating the techno-mumbojumbo, because even business-speak can sound more like business-babbling—and not just to the technical folks.

Additionally, don’t be afraid to ask questions or admit when you don’t know the answers.  Many costly mistakes can be made when people assume that others know (or pretend to know themselves) what key concepts and other terminology actually mean.

Never underestimate the potential negative impacts that the point of view paradox can have on communication.  For example, the perspectives of the business and technical stakeholders can often appear to be diametrically opposed.

Practicing effective communication requires shutting our mouth, opening our ears, and empathically listening to each other, instead of continuing to practice ineffective communication, where we merely take turns throwing word-darts at each other.

Collaboration

WindowsLiveWriter-FindingDataQuality_F0E9-

“Oh and one more thing:

When facing the daunting challenge of collaboration,

Work through it together, don't avoid it.

Come on, trust each other on this one.

Yes—trust—it’s what successful teams do.”

Most organizations suffer from a lack of collaboration, and as noted earlier, without true enterprise-wide collaboration, true success is impossible.

Beyond the data silo problem, the most common challenge for collaboration is the divide perceived to exist between the Business and IT, where the Business usually owns the data and understands its meaning and use in the day-to-day operation of the enterprise, and IT usually owns the hardware and software infrastructure of the enterprise’s technical architecture.

However, neither the Business nor IT alone has all of the necessary knowledge and resources required to truly be successful.  Data quality requires that the Business and IT forge an ongoing and iterative collaboration.

You must rally the team that will work together to improve the quality of your data.  A cross-disciplinary team will truly be necessary because data quality is neither a business issue nor a technical issue—it is both, truly making it an enterprise issue.

Executive sponsors, business and technical stakeholders, business analysts, data stewards, technology experts, and yes, even consultants and contractors—only when all of you are truly working together as a collaborative team, can the enterprise truly achieve great things, both tactically and strategically.

Successful enterprise information management is spelled E—A—C.

Of course, that stands for Enterprises—Always—Collaborate.  The EAC can be one seriously challenging place, dude.

You don’t know if you know what they know, or if they know what you know, but when you know, then they know, you know?

It’s like first you are all like “Whoa!” and they are all like “Whoaaa!” then you are like “Sweet!” and then they are like “Totally!”

This critical need for collaboration might seem rather obvious.  However, as all of the great philosophers have taught us, sometimes the hardest thing to learn is the least complicated.

Okay.  Squirt will now give you a rundown of the proper collaboration technique:

“Good afternoon. We’re gonna have a great collaboration today.

Okay, first crank a hard cutback as you hit the wall.

There’s a screaming bottom curve, so watch out.

Remember: rip it, roll it, and punch it.”

Finding Data Quality

WindowsLiveWriter-FindingDataQuality_F0E9-

As more and more organizations realize the critical importance of viewing data as a strategic corporate asset, data quality is becoming an increasingly prevalent topic of discussion.

However, and somewhat understandably, data quality is sometimes viewed as a small fish—albeit with a “lucky fin”—in a much larger pond.

In other words, data quality is often discussed only in its relation to enterprise information initiatives such as data integration, master data management, data warehousing, business intelligence, and data governance.

There is nothing wrong with this perspective, and as a data quality expert, I admit to my general tendency to see data quality in everything.  However, regardless of the perspective from which you begin your journey, I believe that eventually you will be Finding Data Quality wherever you look as well.

MDM, Assets, Locations, and the TARDIS

Henrik Liliendahl Sørensen, as usual, is facilitating excellent discussion around master data management (MDM) concepts via his blog.  Two of his recent posts, Multi-Entity MDM vs. Multi-Domain MDM and The Real Estate Domain, have both received great commentary.  So, in case you missed them, be sure to read those posts, and join in their comment discussions/debates.

A few of the concepts discussed and debated reminded me of the OCDQ Radio episode Demystifying Master Data Management, during which guest John Owens explained the three types of data (Transaction, Domain, Master), the four master data entities (Party, Product, Location, Asset), as well as, and perhaps the most important concept of all, the Party-Role Relationship, which is where we find many of the terms commonly used to describe the Party master data entity (e.g., Customer, Supplier, Employee).

Henrik’s second post touched on Location and Asset, which come up far less often in MDM discussions than Party and Product do, and arguably with understandably good reason.  This reminded me of the science fiction metaphor I used during my podcast with John, a metaphor I made in an attempt to help explain the difference and relationship between an Asset and a Location.

Location is often over-identified with postal address, which is actually just one means of referring to a location.  A location can also be referred to by its geographic coordinates, either absolute (e.g., latitude and longitude) or relative (e.g., 7 miles northeast of the intersection of Route 66 and Route 54).

Asset refers to a resource owned or controlled by an enterprise and capable of producing business value.  Assets are often over-identified with their location, especially real estate assets such as a manufacturing plant or an office building, since they are essentially immovable assets always at a particular location.

However, many assets are movable, such as the equipment used to manufacture products, or the technology used to support employee activities.  These assets are not always at a particular location (e.g., laptops and smartphones used by employees) and can also be dependent on other, non-co-located, sub-assets (e.g., replacement parts needed to repair broken equipment).

In Doctor Who, a brilliant British science fiction television program celebrating its 50th anniversary this year, the TARDIS, which stands for Time and Relative Dimension in Space, is the time machine and spaceship the Doctor and his companions travel in.

The TARDIS is arguably the Doctor’s most important asset, but its location changes frequently, both during and across episodes.

So, in MDM, we could say that Location is a time and relative dimension in space where we would currently find an Asset.


Related Posts

OCDQ Radio - Demystifying Master Data Management

OCDQ Radio - Master Data Management in Practice

OCDQ Radio - The Art of Data Matching

Plato’s Data

Once Upon a Time in the Data

The Data Cold War

DQ-BE: Single Version of the Time

The Data Outhouse

Fantasy League Data Quality

OCDQ Radio - The Blue Box of Information Quality

Choosing Your First Master Data Domain

Lycanthropy, Silver Bullets, and Master Data Management

Voyage of the Golden Records

The Quest for the Golden Copy

How Social can MDM get?

Will Social MDM be the New Spam?

More Thoughts about Social MDM

Is Social MDM going the Wrong Way?

The Semantic Future of MDM

Small Data and VRM

A Tale of Two Datas

Is big data more than just lots and lots of data?  Is big data unstructured and not-so-big data structured?  Malcolm Chisholm explored these questions in his recent Information Management column, where he posited that there are, in fact, two datas.

“One type of data,” Chisholm explained,  “represents non-material entities in vast computerized ecosystems that humans create and manage.  The other data consists of observations of events, which may concern material or non-material entities.”

Providing an example of the first type, Chisholm explained, “my bank account is not a physical thing at all; it is essentially an agreed upon idea between myself, the bank, the legal system, and the regulatory authorities.  It only exists insofar as it is represented, and it is represented in data.  The balance in my bank account is not some estimate with a positive and negative tolerance; it is exact.  The non-material entities of the financial sector are orderly human constructs.  Because they are orderly, we can more easily manage them in computerized environments.”

The orderly human constructs that are represented in data, in the stories told by data (including the stories data tell about us and the stories we tell data) is one of my favorite topics.  In our increasingly data-constructed world, it’s important to occasionally remind ourselves that data and the real world are not the same thing, especially when data represents non-material entities since, with the possible exception of Makers using 3-D printers, data-represented entities do not re-materialize into the real world.

Describing the second type, Chisholm explained, “a measurement is usually a comparison of a characteristic using some criteria, a count of certain instances, or the comparison of two characteristics.  A measurement can generally be quantified, although sometimes it’s expressed in a qualitative manner.  I think that big data goes beyond mere measurement, to observations.”

Chisholm called the first type the Data of Representation, and the second type the Data of Observation.

The data of representation tends to be structured, in the relational sense, but doesn’t need to be (e.g., graph databases) and the data of observation tends to be unstructured, but it can also be structured (e.g., the structured observations generated by either a data profiling tool analyzing structured relational tables or flat files, or a word-counting algorithm analyzing unstructured text).

Structured and unstructured,” Chisholm concluded, “describe form, not essence, and I suggest that representation and observation describe the essences of the two datas.  I would also submit that both datas need different data management approaches.  We have a good idea what these are for the data of representation, but much less so for the data of observation.”

I agree that there are two types of data (i.e., representation and observation, not big and not-so-big) and that different data uses will require different data management approaches.  Although data modeling is still important and data quality still matters, how much data modeling and data quality is needed before data can be effectively used for specific business purposes will vary.

In order to move our discussions forward regarding “big data” and its data management and business intelligence challenges, we have to stop fiercely defending our traditional perspectives about structure and quality in order to effectively manage both the form and essence of the two datas.  We also have to stop fiercely defending our traditional perspectives about data analytics, since there will be some data use cases where depth and detailed analysis may not be necessary to provide business insight.


A Tale of Two Datas

In conclusion, and with apologies to Charles Dickens and his A Tale of Two Cities, I offer the following A Tale of Two Datas:

It was the best of times, it was the worst of times.
It was the age of Structured Data, it was the age of Unstructured Data.
It was the epoch of SQL, it was the epoch of NoSQL.
It was the season of Representation, it was the season of Observation.
It was the spring of Big Data Myth, it was the winter of Big Data Reality.
We had everything before us, we had nothing before us,
We were all going direct to hoarding data, we were all going direct the other way.
In short, the period was so far like the present period, that some of its noisiest authorities insisted on its being signaled, for Big Data or for not-so-big data, in the superlative degree of comparison only.

Related Posts

HoardaBytes and the Big Data Lebowski

The Idea of Order in Data

The Most August Imagination

Song of My Data

The Lies We Tell Data

Our Increasingly Data-Constructed World

Plato’s Data

OCDQ Radio - Demystifying Master Data Management

OCDQ Radio - Data Quality and Big Data

Big Data: Structure and Quality

Swimming in Big Data

Sometimes it’s Okay to be Shallow

Darth Vader, Big Data, and Predictive Analytics

The Big Data Theory

Finding a Needle in a Needle Stack

Exercise Better Data Management

Magic Elephants, Data Psychics, and Invisible Gorillas

Why Can’t We Predict the Weather?

Data and its Relationships with Quality

A Tale of Two Q’s

A Tale of Two G’s

Turning the M Upside Down

I am often asked about the critical success factors for enterprise initiatives, such as data quality, master data management, and data governance.

Although there is no one thing that can guarantee success, if forced to choose one critical success factor to rule them all, I would choose collaboration.

But, of course, when I say this everyone rolls their eyes at me (yes, I can see you doing it now through the computer) since it sounds like I’m avoiding the complex concepts underlying enterprise initiatives by choosing collaboration.

The importance of collaboration is a very simple concept but, as Amy Ray and Emily Saliers taught me, “the hardest to learn was the least complicated.”


The Pronoun Test

Although all organizations must define the success of enterprise initiatives in business terms (e.g., mitigated risks, reduced costs, or increased revenue), collaborative organizations understand that the most important factor for enduring business success is the willingness of people all across the enterprise to mutually pledge to each other their communication, cooperation, and trust.

These organizations pass what Robert Reich calls the Pronoun Test.  When their employees make references to the company, it’s done with the pronoun We and not They.  The latter suggests at least some amount of disengagement, and perhaps even alienation, whereas the former suggests the opposite — employees feel like part of something significant and meaningful.

An even more basic form of the Pronoun Test is whether or not people can look beyond their too often self-centered motivations and selflessly include themselves in a collaborative effort.  “It’s amazing how much can be accomplished if no one cares who gets the credit” is an old quote for which, with an appropriate irony, it is rather difficult to identify the original source.

Collaboration requires a simple, but powerful, paradigm shift that I call Turning the M Upside Down — turning Me into We.


Related Posts

The Algebra of Collaboration

The Business versus IT—Tear down this wall!

The Road of Collaboration

Dot Collectors and Dot Connectors

No Datum is an Island of Serendip

The Three Most Important Letters in Data Governance

The Stakeholder’s Dilemma

Shining a Social Light on Data Quality

Data Quality and the Bystander Effect

The Family Circus and Data Quality

The Year of the Datechnibus

Being Horizontally Vertical

The Collaborative Culture of Data Governance

Collaboration isn’t Brain Surgery

Are you Building Bridges or Digging Moats?

Exercise Better Data Management

Recently on Twitter, Daragh O Brien and I discussed his proposed concept.  “After Big Data,” Daragh tweeted, “we will inevitably begin to see the rise of MOData as organizations seek to grab larger chunks of data and digest it.  What is MOData?  It’s MO’Data, as in MOre Data. Or Morbidly Obese Data.  Only good data quality and data governance will determine which.”

Daragh asked if MO’Data will be the Big Data Killer.  I said only if MO’Data doesn’t include MO’BusinessInsight, MO’DataQuality, and MO’DataPrivacy (i.e., more business insight, more data quality, and more data privacy).

“But MO’Data is about more than just More Data,” Daragh replied.  “It’s about avoiding Morbidly Obese Data that clogs data insight and data quality, etc.”

I responded that More Data becomes Morbidly Obese Data only if we don’t exercise better data management practices.

Agreeing with that point, Daragh replied, “Bring on MOData and the Pilates of Data Quality and Data Governance.”

To slightly paraphrase lines from one of my favorite movies — Airplane! — the Cloud is getting thicker and the Data is getting laaaaarrrrrger.  Surely I know well that growing data volumes is a serious issue — but don’t call me Shirley.

Whether you choose to measure it in terabytes, petabytes, exabytes, HoardaBytes, or how much reality bites, the truth is we were consuming way more than our recommended daily allowance of data long before the data management industry took a tip from McDonald’s and put the word “big” in front of its signature sandwich.  (Oh great . . . now I’m actually hungry for a Big Mac.)

But nowadays with silos replicating data, as well as new data, and new types of data, being created and stored on a daily basis, our data is resembling the size of Bob Parr in retirement, making it seem like not even Mr. Incredible in his prime possessed the super strength needed to manage all of our data.  Those were references to the movie The Incredibles, where Mr. Incredible was a superhero who, after retiring into civilian life under the alias of Bob Parr, elicits the observation from this superhero costume tailor: “My God, you’ve gotten fat.”  Yes, I admit not even Helen Parr (aka Elastigirl) could stretch that far for a big data joke.

A Healthier Approach to Big Data

Although Daragh’s concerns about morbidly obese data are valid, no superpowers (or other miracle exceptions) are needed to manage all of our data.  In fact, it’s precisely when we are so busy trying to manage all of our data that we hoard countless bytes of data without evaluating data usage, gathering data requirements, or planning for data archival.  It’s like we are trying to lose weight by eating more and exercising less, i.e., consuming more data and exercising less data quality and data governance.  As Daragh said, only good data quality and data governance will determine whether we get more data or morbidly obese data.

Losing weight requires a healthy approach to both diet and exercise.  A healthy approach to diet includes carefully choosing the food you consume and carefully controlling your portion size.  A healthy approach to exercise includes a commitment to exercise on a regular basis at a sufficient intensity level without going overboard by spending several hours a day, every day, at the gym.

Swimming is a great form of exercise, but swimming in big data without having a clear business objective before you jump into the pool is like telling your boss that you didn’t get any work done because you decided to spend all day working out at the gym.

Carefully choosing the data you consume and carefully controlling your data portion size is becoming increasingly important since big data is forcing us to revisit information overload.  However, the main reason that traditional data management practices often become overwhelmed by big data is because traditional data management practices are not always the right approach.

We need to acknowledge that some big data use cases differ considerably from traditional ones.  Data modeling is still important and data quality still matters, but how much data modeling and data quality is needed before big data can be effectively used for business purposes will vary.  In order to move the big data discussion forward, we have to stop fiercely defending our traditional perspectives about structure and quality.  We also have to stop fiercely defending our traditional perspectives about analytics, since there will be some big data use cases where depth and detailed analysis may not be necessary to provide business insight.

Better than Big or More

Jim Ericson explained that your data is big enough.  Rich Murnane explained that bigger isn’t better, better is better.  Although big data may indeed be followed by more data that doesn’t necessarily mean we require more data management in order to prevent more data from becoming morbidly obese data.  I think that we just need to exercise better data management.


Related Posts

Demystifying Master Data Management

OCDQ Radio is a vendor-neutral podcast about data quality and its related disciplines, produced and hosted by Jim Harris.

During this episode, special guest John Owens and I attempt to demystify master data management (MDM) by explaining the three types of data (Transaction, Domain, Master) and the four master data entities (Party, Product, Location, Asset), as well as, and perhaps the most important concept of all, the Party-Role Relationship, which is where we find many of the terms commonly used to describe the Party master data entity (e.g., Customer, Supplier, Employee).

John Owens is a thought leader, consultant, mentor, and writer in the worlds of business and data modelling, data quality, and master data management (MDM).  He has built an international reputation as a highly innovative specialist in these areas and has worked in and led multi-million dollar projects in a wide range of industries around the world.

John Owens has a gift for identifying the underlying simplicity in any enterprise, even when shrouded in complexity, and bringing it to the surface.  He is the creator of the Integrated Modelling Method (IMM), which is used by business and data analysts around the world.  Later this year, John Owens will be formally launching the IMM Academy, which will provide high quality resources, training, and mentoring for business and data analysts at all levels.

You can also follow John Owens on Twitter and connect with John Owens on Linkedin.  And if you’re looking for a MDM course, consider the online course from John Owens, which you can find by clicking on this link: MDM Online Course (Affiliate Link)

Popular OCDQ Radio Episodes

Clicking on the link will take you to the episode’s blog post:

  • Demystifying Data Science — Guest Melinda Thielbar, a Ph.D. Statistician, discusses what a data scientist does and provides a straightforward explanation of key concepts such as signal-to-noise ratio, uncertainty, and correlation.
  • Data Quality and Big Data — Guest Tom Redman (aka the “Data Doc”) discusses Data Quality and Big Data, including if data quality matters less in larger data sets, and if statistical outliers represent business insights or data quality issues.
  • Data Governance Star Wars — Special Guests Rob Karel and Gwen Thomas joined this extended, and Star Wars themed, discussion about how to balance bureaucracy and business agility during the execution of data governance programs.
  • The Johari Window of Data Quality — Guest Martin Doyle discusses helping people better understand their data and assess its business impacts, not just the negative impacts of bad data quality, but also the positive impacts of good data quality.
  • Studying Data Quality — Guest Gordon Hamilton discusses the key concepts from recommended data quality books, including those which he has implemented in his career as a data quality practitioner.

Data Myopia and Business Relativity

Since how data quality is defined has a significant impact on how data quality is perceived, measured, and managed, in this post I examine the two most prevalent perspectives on defining data quality, real-world alignment and fitness for the purpose of use, which respectively represent what I refer to as the danger of data myopia and the challenge of business relativity.

Real-World Alignment: The Danger of Data Myopia

Whether it’s an abstract description of real-world entities (i.e., master data) or an abstract description of real-world interactions (i.e., transaction data) among entities, data is an abstract description of reality.  The creation and maintenance of these abstract descriptions shapes the organization’s perception of the real world, which I philosophically pondered in my post Plato’s Data.

The inconvenient truth is that the real world is not the same thing as the digital worlds captured within our databases.

And, of course, creating and maintaining these digital worlds is no easy task, which is exactly the danger inherent with the real-world alignment definition of data quality — when the organization’s data quality efforts are focused on minimizing the digital distance between data and the constantly changing real world that data attempts to describe, it can lead to a hyper-focus on the data in isolation, otherwise known as data myopia.

Even if we create and maintain perfect real-world alignment, what value does high-quality data possess independent of its use?

Real-world alignment reflects the perspective of the data provider, and its advocates argue that providing a trusted source of data to the organization will be able to satisfy any and all business requirements, i.e., high-quality data should be fit to serve as the basis for every possible use.  Therefore, in theory, real-world alignment provides an objective data foundation independent of the subjective uses defined by the organization’s many data consumers.

However, providing the organization with a single system of record, a single version of the truth, a single view, a golden copy, or a consolidated repository of trusted data has long been the rallying cry and siren song of enterprise data warehousing (EDW), and more recently, of master data management (MDM).  Although these initiatives can provide significant business value, it is usually poor data quality that undermines the long-term success and sustainability of EDW and MDM implementations.

Perhaps the enterprise needs a Ulysses pact to protect it from believing in EDW or MDM as a miracle exception for data quality?

A significant challenge for the data provider perspective on data quality is that it is difficult to make a compelling business case on the basis of trusted data without direct connections to the specific business needs of data consumers, whose business, data, and technical requirements are often in conflict with one another.

In other words, real-world alignment does not necessarily guarantee business-world alignment.

So, if using real-world alignment as the definition of data quality has inherent dangers, we might be tempted to conclude that the fitness for the purpose of use definition of data quality is the better choice.  Unfortunately, that is not necessarily the case.

Fitness for the Purpose of Use: The Challenge of Business Relativity

Relativity.jpg

In M. C. Escher’s famous 1953 lithograph Relativity, although we observe multiple, and conflicting, perspectives of reality, from the individual perspective of each person, everything must appear normal, since they are all casually going about their daily activities.

I have always thought this is an apt analogy for the multiple business perspectives on data quality that exists within every organization.

Like truth, beauty, and art, data quality can be said to be in the eyes of the beholder, or when data quality is defined as fitness for the purpose of use — the eyes of the user.

Most data has both multiple uses and users.  Data of sufficient quality for one use or user may not be of sufficient quality for other uses and users.  These multiple, and often conflicting, perspectives are considered irrelevant from the perspective of an individual user, who just needs quality data to support their own business activities.

Therefore, the user (i.e., data consumer) perspective establishes a relative business context for data quality.

Whereas the real-world alignment definition of data quality can cause a data-myopic focus, the business-world alignment goal of the fitness for the purpose of use definition must contend with the daunting challenge of business relativity.  Most data has multiple data consumers, each with their own relative business context for data quality, making it difficult to balance the diverse data needs and divergent data quality perspectives within the conflicting, and rather Escher-like, reality of the organization.

The data consumer perspective on data quality is often the root cause of the data silo problem, the bane of successful enterprise data management prevalent in most organizations, where each data consumer maintains their own data silo, customized to be fit for the purpose of their own use.  Organizational culture and politics also play significant roles since data consumers legitimately fear that losing their data silos would revert the organization to a one-size-fits-all data provider perspective on data quality.

So, clearly the fitness for the purpose of use definition of data quality is not without its own considerable challenges to overcome.

How does your organization define data quality?

As I stated at the beginning of this post, how data quality is defined has a significant impact on how data quality is perceived, measured, and managed.  I have witnessed the data quality efforts of an organization struggle with, and at times fail because of, either the danger of data myopia or the challenge of business relativity — or, more often than not, some combination of both.

Although some would define real-world alignment as data quality and fitness for the purpose of use as information quality, I have found adding the nuance of data versus information only further complicates an organization’s data quality discussions.

But for now, I will just conclude a rather long (sorry about that) post by asking for reader feedback on this perennial debate.

How does your organization define data quality?  Please share your thoughts and experiences by posting a comment below.

Data Driven

OCDQ Radio is a vendor-neutral podcast about data quality and its related disciplines, produced and hosted by Jim Harris.

This is Part 1 of 2 from my recent discussion with Tom Redman.  In this episode, Tom and I discuss concepts from one of my favorite data quality books, which is his most recent book: Data Driven: Profiting from Your Most Important Business Asset.

Our discussion includes viewing data as an asset, an organization’s hierarchy of data needs, a simple model for culture change, and attempting to achieve the “single version of the truth” being marketed as a goal of master data management (MDM).

Dr. Thomas C. Redman (the “Data Doc”) is an innovator, advisor, and teacher.  He was first to extend quality principles to data and information in the late 80s.  Since then he has crystallized a body of tools, techniques, roadmaps and organizational insights that help organizations make order-of-magnitude improvements.

More recently Tom has developed keen insights into the nature of data and formulated the first comprehensive approach to “putting data to work.”  Taken together, these enable organizations to treat data as assets of virtually unlimited potential.

Tom has personally helped dozens of leaders and organizations better understand data and data quality and start their data programs.  He is a sought-after lecturer and the author of dozens of papers and four books.

Prior to forming Navesink Consulting Group in 1996, Tom conceived the Data Quality Lab at AT&T Bell Laboratories in 1987 and led it until 1995. Tom holds a Ph.D. in statistics from Florida State University.  He holds two patents.

Popular OCDQ Radio Episodes

Clicking on the link will take you to the episode’s blog post:

  • Demystifying Data Science — Guest Melinda Thielbar, a Ph.D. Statistician, discusses what a data scientist does and provides a straightforward explanation of key concepts such as signal-to-noise ratio, uncertainty, and correlation.
  • Data Quality and Big Data — Guest Tom Redman (aka the “Data Doc”) discusses Data Quality and Big Data, including if data quality matters less in larger data sets, and if statistical outliers represent business insights or data quality issues.
  • Demystifying Master Data Management — Guest John Owens explains the three types of data (Transaction, Domain, Master), the four master data entities (Party, Product, Location, Asset), and the Party-Role Relationship, which is where we find many of the terms commonly used to describe the Party master data entity (e.g., Customer, Supplier, Employee).
  • Data Governance Star Wars — Special Guests Rob Karel and Gwen Thomas joined this extended, and Star Wars themed, discussion about how to balance bureaucracy and business agility during the execution of data governance programs.
  • The Johari Window of Data Quality — Guest Martin Doyle discusses helping people better understand their data and assess its business impacts, not just the negative impacts of bad data quality, but also the positive impacts of good data quality.
  • Studying Data Quality — Guest Gordon Hamilton discusses the key concepts from recommended data quality books, including those which he has implemented in his career as a data quality practitioner.