Caffeinated Thoughts on Technology for Midsize Businesses

If you are having trouble viewing this video, then you can watch it on Vimeo via this link:vimeo.com/71338997

The following links are to the resources featured in or related to the content of this video:

  • Get Bold with Your Social Media: http://goo.gl/PCQ11 (Sandy Carter Book Review by Debbie Laskey)
IBM Logo.jpg

A Big Data Platform for Midsize Businesses

If you’re having trouble viewing this video, watch it on Vimeo via this link:A Big Data Platform for Midsize Businesses

The following links are to the infographics featured in this video, as well as links to other related resources:

  • Webcast Replay: Why Big Data Matters to the Midmarket: http://goo.gl/A1WYZ (No Registration Required)
  • IBM’s 2012 Big Data Study with Feedback from People who saw Results: http://goo.gl/MmRAv (Registration Required)
  • Participate in IBM’s 2013 Business Value Survey on Analytics and Big Data: http://goo.gl/zKSPM (Registration Required)
IBM Logo.jpg

Cloud Benefits for Midsize Businesses

If you’re having trouble viewing this video, watch it on Vimeo via this link:Cloud Benefits for Midsize Businesses on Vimeo

The following links are to the infographics and eBook featured in this video, as well as other related resources:

IBM Logo.jpg

The Big Datastillery

If you’re having trouble viewing this video, you can watch it on Vimeo by clicking on this link: The Big Datastillery on Vimeo

To view or download the infographic featured in the video, click on this direct link to its PDF: The Big Datastillery.pdf


This video was sponsored by the IBM for Midsize Business program, which provides midsize businesses with the tools, expertise and solutions they need to become engines of a smarter planet. I’ve been compensated to contribute to this program, but the opinions expressed in this video are my own and don’t necessarily represent IBM’s positions, strategies, or opinions.


Related Posts

Smart Big Data Adoption for Midsize Businesses

Big Data is not just for Big Businesses

Social Business is more than Social Marketing

Social Media Marketing: From Monologues to Dialogues

Social Media for Midsize Businesses

Cloud Computing is the New Nimbyism

Leveraging the Cloud for Application Development

Barriers to Cloud Adoption

Will Big Data be Blinded by Data Science?

Big Data Lessons from Orbitz

The Graystone Effects of Big Data

Talking Business about the Weather

Word of Mouth has become Word of Data

Information Asymmetry versus Empowered Customers

The Age of the Mobile Device

Devising a Mobile Device Strategy

Cloud Computing for Midsize Businesses

OCDQ Radio is a vendor-neutral podcast about data quality and its related disciplines, produced and hosted by Jim Harris.

During this episode, Ed Abrams and I discuss cloud computing for midsize businesses, and, more specifically, we discuss aspects of the recently launched IBM global initiatives to help Managed Service Providers (MSP) deliver cloud-based service offerings.

Ed Abrams is the Vice President of Marketing, IBM Midmarket.  In this role, Ed is responsible for leading a diverse team that supports IBM’s business objectives with small and midsize businesses by developing, planning, and executing offerings and go-to-market strategies designed to help midsize businesses grow.  In this role Ed works closely and collaboratively with sales and channels teams, and agency partners to deliver high-quality and effective marketing strategies, offerings, and campaigns.

There is No Such Thing as a Root Cause

Root cause analysis.  Most people within the industry, myself included, often discuss the importance of determining the root cause of data governance and data quality issues.  However, the complex cause and effect relationships underlying an issue means that when an issue is encountered, often you are only seeing one of the numerous effects of its root cause (or causes).

In my post The Root! The Root! The Root Cause is on Fire!, I poked fun at those resistant to root cause analysis with the lyrics:

The Root! The Root! The Root Cause is on Fire!
We don’t want to determine why, just let the Root Cause burn.
Burn, Root Cause, Burn!

However, I think that the time is long overdue for even me to admit the truth — There is No Such Thing as a Root Cause.

Before you charge at me with torches and pitchforks for having an Abby Normal brain, please allow me to explain.


Defect Prevention, Mouse Traps, and Spam Filters

Some advocates of defect prevention claim that zero defects is not only a useful motivation, but also an attainable goal.  In my post The Asymptote of Data Quality, I quoted Daniel Pink’s book Drive: The Surprising Truth About What Motivates Us:

“Mastery is an asymptote.  You can approach it.  You can home in on it.  You can get really, really, really close to it.  But you can never touch it.  Mastery is impossible to realize fully.

The mastery asymptote is a source of frustration.  Why reach for something you can never fully attain?

But it’s also a source of allure.  Why not reach for it?  The joy is in the pursuit more than the realization.

In the end, mastery attracts precisely because mastery eludes.”

The mastery of defect prevention is sometimes distorted into a belief in data perfection, into a belief that we can not just build a better mousetrap, but we can build a mousetrap that could catch all the mice, or that by placing a mousetrap in our garage, which prevents mice from entering via the garage, we somehow also prevent mice from finding another way into our house.

Obviously, we can’t catch all the mice.  However, that doesn’t mean we should let the mice be like Pinky and the Brain:

Pinky: “Gee, Brain, what do you want to do tonight?”

The Brain: “The same thing we do every night, Pinky — Try to take over the world!”

My point is that defect prevention is not the same thing as defect elimination.  Defects evolve.  An excellent example of this is spam.  Even conservative estimates indicate almost 80% of all e-mail sent world-wide is spam.  A similar percentage of blog comments are spam, and spam generating bots are quite prevalent on Twitter and other micro-blogging and social networking services.  The inconvenient truth is that as we build better and better spam filters, spammers create better and better spam.

Just as mousetraps don’t eliminate mice and spam filters don’t eliminate spam, defect prevention doesn’t eliminate defects.

However, mousetraps, spam filters, and defect prevention are essential proactive best practices.


There are No Lines of Causation — Only Loops of Correlation

There are no root causes, only strong correlations.  And correlations are strengthened by continuous monitoring.  Believing there are root causes means believing continuous monitoring, and by extension, continuous improvement, has an end point.  I call this the defect elimination fallacy, which I parodied in song in my post Imagining the Future of Data Quality.

Knowing there are only strong correlations means knowing continuous improvement is an infinite feedback loop.  A practical example of this reality comes from data-driven decision making, where:

  1. Better Business Performance is often correlated with
  2. Better Decisions, which, in turn, are often correlated with
  3. Better Data, which is precisely why Better Decisions with Better Data is foundational to Business Success — however . . .

This does not mean that we can draw straight lines of causation between (3) and (1), (3) and (2), or (2) and (1).

Despite our preference for simplicity over complexity, if bad data was the root cause of bad decisions and/or bad business performance, every organization would never be profitable, and if good data was the root cause of good decisions and/or good business performance, every organization could always be profitable.  Even if good data was a root cause, not just a correlation, and even when data perfection is temporarily achieved, the effects would still be ephemeral because not only do defects evolve, but so does the business world.  This evolution requires an endless revolution of continuous monitoring and improvement.

Many organizations implement data quality thresholds to close the feedback loop evaluating the effectiveness of their data management and data governance, but few implement decision quality thresholds to close the feedback loop evaluating the effectiveness of their data-driven decision making.

The quality of a decision is determined by the business results it produces, not the person who made the decision, the quality of the data used to support the decision, or even the decision-making technique.  Of course, the reality is that business results are often not immediate and may sometimes be contingent upon the complex interplay of multiple decisions.

Even though evaluating decision quality only establishes a correlation, and not a causation, between the decision execution and its business results, it is still essential to continuously monitor data-driven decision making.

Although the business world will never be totally predictable, we can not turn a blind eye to the need for data-driven decision making best practices, or the reality that no best practice can eliminate the potential for poor data quality and decision quality, nor the potential for poor business results even despite better data quality and decision quality.  Central to continuous improvement is the importance of closing the feedback loops that make data-driven decisions more transparent through better monitoring, allowing the organization to learn from its decision-making mistakes, and make adjustments when necessary.

We need to connect the dots of better business performance, better decisions, and better data by drawing loops of correlation.


Decision-Data Feedback Loop

Continuous improvement enables better decisions with better data, which drives better business performance — as long as you never stop looping the Decision-Data Feedback Loop, and start accepting that there is no such thing as a root cause.

I discuss this, and other aspects of data-driven decision making, in my DataFlux white paper, which is available for download (registration required) using the following link: Decision-Driven Data Management


Related Posts

The Root! The Root! The Root Cause is on Fire!

Bayesian Data-Driven Decision Making

The Role of Data Quality Monitoring in Data Governance

The Circle of Quality

Oughtn’t you audit?

The Dichotomy Paradox, Data Quality and Zero Defects

The Asymptote of Data Quality

To Our Data Perfectionists

Imagining the Future of Data Quality

What going to the Dentist taught me about Data Quality

DQ-Tip: “There is No Such Thing as Data Accuracy...”

The HedgeFoxian Hypothesis

Bayesian Data-Driven Decision Making

In his book Data Driven: Profiting from Your Most Important Business Asset, Thomas Redman recounts the story of economist John Maynard Keynes, who, when asked what he does when new data is presented that does not support his earlier decision, responded: “I change my opinion.  What do you do?”

“This is the way good decision makers behave,” Redman explained.  “They know that a newly made decision is but the first step in its execution.  They regularly and systematically evaluate how well a decision is proving itself in practice by acquiring new data.  They are not afraid to modify their decisions, even admitting they are wrong and reversing course if the facts demand it.”

Since he has a PhD in statistics, it’s not surprising that Redman explained effective data-driven decision making using Bayesian statistics, which is “an important branch of statistics that differs from classic statistics in the way it makes inferences based on data.  One of its advantages is that it provides an explicit means to quantify uncertainty, both a priori, that is, in advance of the data, and a posteriori, in light of the data.”

Good decision makers, Redman explained, follow at least three Bayesian principles:

  1. They bring as much of their prior experience as possible to bear in formulating their initial decision spaces and determining the sorts of data they will consider in making the decision.
  2. For big, important decisions, they adopt decision criteria that minimize the maximum risk.
  3. They constantly evaluate new data to determine how well a decision is working out, and they do not hesitate to modify the decision as needed.

A key concept of statistical process control and continuous improvement is the importance of closing the feedback loop that allows a process to monitor itself, learn from its mistakes, and adjust when necessary.

The importance of building feedback loops into data-driven decision making is too often ignored.

I discuss this, and other aspects of data-driven decision making, in my DataFlux white paper, which is available for download (registration required) using the following link: Decision-Driven Data Management


Related Posts

Decision-Driven Data Management

The Speed of Decision

The Big Data Collider

A Decision Needle in a Data Haystack

The Data-Decision Symphony

Thaler’s Apples and Data Quality Oranges

Satisficing Data Quality

Data Confabulation in Business Intelligence

The Data that Supported the Decision

Data Psychedelicatessen

OCDQ Radio - Big Data and Big Analytics

OCDQ Radio - Good-Enough Data for Fast-Enough Decisions

The Circle of Quality

A Farscape Analogy for Data Quality

OCDQ Radio - Organizing for Data Quality

Data Profiling Early and Often

OCDQ Radio is a vendor-neutral podcast about data quality and its related disciplines, produced and hosted by Jim Harris.

On this episode of OCDQ Radio, I discuss data profiling with James Standen, the founder and CEO of nModal Solutions Inc., the makers of Datamartist, which is a fast, easy to use, visual data profiling and transformation tool.

Before founding nModal, James had over 15 years experience in a broad range of roles involving data, ranging from building business intelligence solutions, creating data warehouses and a data warehouse competency center, through to working on data migration and ERP projects in large organizations.  You can learn more about and connect with James Standen on LinkedIn.

James thinks that while there is obviously good data and bad data, that often bad data is just misunderstood and can be coaxed away from the dark side if you know how to approach it.  He does recommend wearing the proper safety equipment however, and having the right tools.  For more of his wit and wisdom, follow Datamartist on Twitter, and read the Datamartist Blog.

Popular OCDQ Radio Episodes

Clicking on the link will take you to the episode’s blog post:

  • Demystifying Data Science — Guest Melinda Thielbar, a Ph.D. Statistician, discusses what a data scientist does and provides a straightforward explanation of key concepts such as signal-to-noise ratio, uncertainty, and correlation.
  • Data Quality and Big Data — Guest Tom Redman (aka the “Data Doc”) discusses Data Quality and Big Data, including if data quality matters less in larger data sets, and if statistical outliers represent business insights or data quality issues.
  • Demystifying Master Data Management — Guest John Owens explains the three types of data (Transaction, Domain, Master), the four master data entities (Party, Product, Location, Asset), and the Party-Role Relationship, which is where we find many of the terms commonly used to describe the Party master data entity (e.g., Customer, Supplier, Employee).
  • Data Governance Star Wars — Special Guests Rob Karel and Gwen Thomas joined this extended, and Star Wars themed, discussion about how to balance bureaucracy and business agility during the execution of data governance programs.
  • The Johari Window of Data Quality — Guest Martin Doyle discusses helping people better understand their data and assess its business impacts, not just the negative impacts of bad data quality, but also the positive impacts of good data quality.
  • Studying Data Quality — Guest Gordon Hamilton discusses the key concepts from recommended data quality books, including those which he has implemented in his career as a data quality practitioner.

Alternatives to Enterprise Data Quality Tools

The recent analysis by Andy Bitterer of Gartner Research (and ANALYSTerical) about the acquisition of open source data quality tool DataCleaner by the enterprise data quality vendor Human Inference, prompted the following Twitter conversation:

Since enterprise data quality tools can be cost-prohibitive, more prospective customers are exploring free and/or open source alternatives, such as the Talend Open Profiler, licensed under the open source General Public License, or non-open source, but entirely free alternatives, such as the Ataccama DQ Analyzer.  And, as Andy noted in his analysis, both of these tools offer an easy transition to the vendors’ full-fledged commercial data quality tools, offering more than just data profiling functionality.

As Henrik Liliendahl Sørensen explained, in his blog post Data Quality Tools Revealed, data profiling is the technically easiest part of data quality, which explains the tool diversity, and early adoption of free and/or open source alternatives.

And there are also other non-open source alternatives that are more affordable than enterprise data quality tools, such as Datamartist, which combines data profiling and data migration capabilities into an easy-to-use desktop application.

My point is neither to discourage the purchase of enterprise data quality tools, nor promote their alternatives—and this blog post is certainly not an endorsement—paid or otherwise—of the alternative data quality tools I have mentioned simply as examples.

My point is that many new technology innovations originate from small entrepreneurial ventures, which tend to be specialists with a narrow focus that can provide a great source of rapid innovation.  This is in contrast to the data management industry trend of innovation via acquisition and consolidation, embedding data quality technology within data management platforms, which also provide data integration and master data management (MDM) functionality as well, allowing the mega-vendors to offer end-to-end solutions and the convenience of one-vendor information technology shopping.

However, most software licenses for these enterprise data management platforms start in the six figures.  On top of the licensing, you have to add the annual maintenance fees, which are usually in the five figures.  Add to the total cost of the solution, the professional services that are needed for training and consulting for installation, configuration, application development, testing, and production implementation—and you have another six figure annual investment.

Debates about free and/or open source software usually focus on the robustness of functionality and the intellectual property of source code.  However, from my perspective, I think that the real reason more prospective customers are exploring these alternatives to enterprise data quality tools is because of the free aspect—but not because of the open source aspect.

In other words—and once again I am only using it as an example—I might download Talend Open Profiler because I wanted data profiling functionality at an affordable price—but not because I wanted the opportunity to customize its source code.

I believe the “try it before you buy it” aspect of free and/or open source software is what’s important to prospective customers.

Therefore, enterprise data quality vendors, instead of acquiring an open source tool as Human Inference did with DataCleaner, how about offering a free (with limited functionality) or trial version of your enterprise data quality tool as an alternative option?


Related Posts

Do you believe in Magic (Quadrants)?

Can Enterprise-Class Solutions Ever Deliver ROI?

Which came first, the Data Quality Tool or the Business Need?

Selling the Business Benefits of Data Quality

What Data Quality Technology Wants

Worthy Data Quality Whitepapers (Part 3)

In my April 2009 blog post Data Quality Whitepapers are Worthless, I called for data quality whitepapers worth reading.

This post is now the third entry in an ongoing series about data quality whitepapers that I have read and can endorse as worthy.


Matching Technology Improves Data Quality

Steve Sarsfield recently published Matching Technology Improves Data Quality, a worthy data quality whitepaper, which is a primer on the elementary principles, basic theories, and strategies of record matching.

This free whitepaper is available for download from Talend (requires registration by providing your full contact information).

The whitepaper describes the nuances of deterministic and probabilistic matching and the algorithms used to identify the relationships among records.  It covers the processes to employ in conjunction with matching technology to transform raw data into powerful information that drives success in enterprise applications, including customer relationship management (CRM), data warehousing, and master data management (MDM).

Steve Sarsfield is the Talend Data Quality Product Marketing Manager, and author of the book The Data Governance Imperative and the popular blog Data Governance and Data Quality Insider.


Whitepaper Excerpts

Excerpts from Matching Technology Improves Data Quality:

  • “Matching plays an important role in achieving a single view of customers, parts, transactions and almost any type of data.”
  • “Since data doesn’t always tell us the relationship between two data elements, matching technology lets us define rules for items that might be related.”
  • “Nearly all experts agree that standardization is absolutely necessary before matching.  The standardization process improves matching results, even when implemented along with very simple matching algorithms.  However, in combination with advanced matching techniques, standardization can improve information quality even more.”
  • “There are two common types of matching technology on the market today, deterministic and probabilistic.”
  • “Deterministic or rules-based matching is where records are compared using fuzzy algorithms.”
  • “Probabilistic matching is where records are compared using statistical analysis and advanced algorithms.”
  • “Data quality solutions often offer both types of matching, since one is not necessarily superior to the other.”
  • “Organizations often evoke a multi-match strategy, where matching is analyzed from various angles.”
  • “Matching is vital to providing data that is fit-for-use in enterprise applications.”
 

Related Posts

Identifying Duplicate Customers

Customer Incognita

To Parse or Not To Parse

The Very True Fear of False Positives

Data Governance and Data Quality

Worthy Data Quality Whitepapers (Part 2)

Worthy Data Quality Whitepapers (Part 1)

Data Quality Whitepapers are Worthless

The 2010 Data Quality Blogging All-Stars

The 2010 Major League Baseball (MLB) All-Star Game is being held tonight (July 13) at Angel Stadium in Anaheim, California.

For those readers who are not baseball fans, the All-Star Game is an annual exhibition held in mid-July that showcases the players with (for the most part) the best statistical performances during the first half of the MLB season.

Last summer, I began my own annual exhibition of showcasing the bloggers whose posts I have personally most enjoyed reading during the first half of the data quality blogging season. 

Therefore, this post provides links to stellar data quality blog posts that were published between January 1 and June 30 of 2010.  My definition of a “data quality blog post” also includes Data Governance, Master Data Management, and Business Intelligence. 

Please Note: There is no implied ranking in the order that bloggers or blogs are listed, other than that Individual Blog All-Stars are listed first, followed by Vendor Blog All-Stars, and the blog posts are listed in reverse chronological order by publication date.


Henrik Liliendahl Sørensen

From Liliendahl on Data Quality:


Dylan Jones

From Data Quality Pro:


Julian Schwarzenbach

From Data and Process Advantage Blog:


Rich Murnane

From Rich Murnane's Blog:


Phil Wright

From Data Factotum:


Initiate – an IBM Company

From Mastering Data Management:


Baseline Consulting

From their three blogs: Inside the Biz with Jill Dyché, Inside IT with Evan Levy, and In the Field with our Experts:


DataFlux – a SAS Company

From Community of Experts:


Related Posts

Recently Read: May 15, 2010

Recently Read: March 22, 2010

Recently Read: March 6, 2010

Recently Read: January 23, 2010

The 2009 Data Quality Blogging All-Stars


Additional Resources

From the IAIDQ, read the 2010 issues of the Blog Carnival for Information/Data Quality:

Do you believe in Magic (Quadrants)?

Twitter

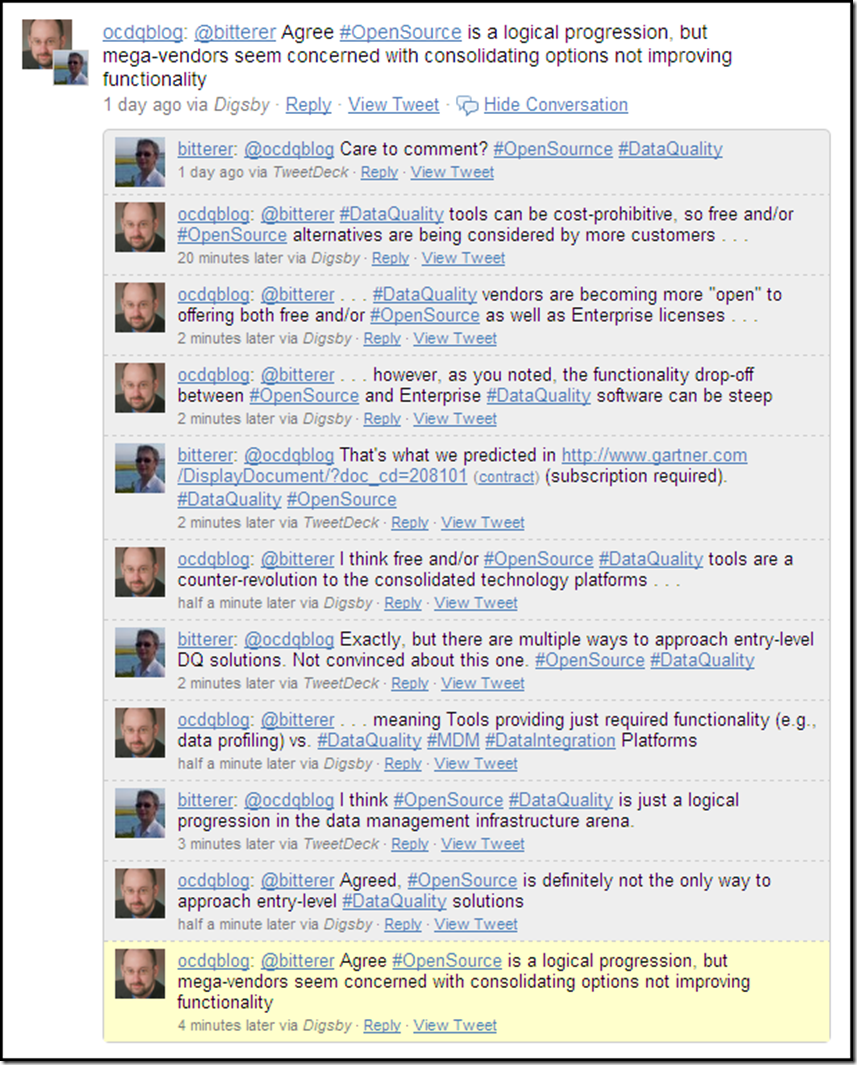
If you follow Data Quality on Twitter like I do, then you are probably already well aware that the 2010 Gartner Magic Quadrant for Data Quality Tools was released this week (surprisingly, it did not qualify as a Twitter trending topic).

The five vendors that were selected as the “data quality market leaders” were SAS DataFlux, IBM, Informatica, SAP Business Objects, and Trillium.

Disclosure: I am a former IBM employee, former IBM Information Champion, and I blog for the Data Roundtable, which is sponsored by SAS.

Please let me stress that I have the highest respect for both Ted Friedman and Andy Bitterer, as well as their in depth knowledge of the data quality industry and their insightful analysis of the market for data quality tools.

In this blog post, I simply want to encourage a good-natured debate, and not about the Gartner Magic Quadrant specifically, but rather about market research in general.  Gartner is used as the example because they are perhaps the most well-known and the source most commonly cited by data quality vendors during the sales cycle—and obviously, especially by the “leading vendors.”

I would like to debate how much of an impact market research really has on a prospect’s decision to purchase a data quality tool.

Let’s agree to keep this to a very informal debate about how research can affect both the perception and the reality of the market.

Therefore—for the love of all high quality data everywhere—please, oh please, data quality vendors, do NOT send me your quarterly sales figures, or have your PR firm mercilessly spam either my comments section or my e-mail inbox with all the marketing collateral “proving” how Supercalifragilisticexpialidocious your data quality tool is—I said please, so play nice.


The OCDQ View on OOBE-DQ

In a previous post, I used the term OOBE-DQ to refer to the out-of-box-experience (OOBE) provided by data quality (DQ) tools, which usually becomes a debate between “ease of use” and “powerful functionality” after you ignore the Magic Beans sales pitch that guarantees you the data quality tool is both remarkably easy to use and incredibly powerful.

However, the data quality market continues to evolve away from esoteric technical tools and toward business-empowering suites providing robust functionality with easier to use and role-based interfaces that are tailored to the specific needs of different users, such as business analysts, data stewards, application developers, and system administrators.

The major players are still the large vendors who have innovated (mostly via acquisition and consolidation) enterprise application development platforms with integrated (to varying degrees) components, which provide not only data quality functionality, but also data integration and master data management (MDM) as well.

Many of these vendors also offer service-oriented deployments delivering the same functionality within more loosely coupled technical architectures, which includes leveraging real-time services to prevent (or at least greatly minimize) poor data quality at the multiple points of origin within the data ecosystem.

Many vendors are also beginning to provide better built-in reporting and data visualization capabilities, which is helping to make the correlation between poor data quality and suboptimal business processes more tangible, especially for executive management.

It must be noted that many vendors (including the “market leaders”) continue to struggle with their International OOBE-DQ. 

Many (if not most) data quality tools are strongest in their native country or their native language, but their OOBE-DQ declines significantly when they travel abroad.  Especially outside of the United States, smaller vendors with local linguistic and cultural expertise built into their data quality tools have continued to remain fiercely competitive with the larger vendors.

Market research certainly has a role to play in making a purchasing decision, and perhaps most notably as an aid in comparing and contrasting features and benefits, which of course, always have to be evaluated against your specific requirements, including both your current and future needs. 

Now let’s shift our focus to examining some of the inherent challenges of evaluating market research, perception, and reality.


Confirmation Bias

First of all, I realize that this debate will suffer from a considerable—and completely understandable—confirmation bias.

If you are a customer, employee, or consultant for one of the “High Five” (not an “official” Gartner Magic Quadrant term for the Leaders), then obviously you have a vested interest in getting inebriated on your own Kool-Aid (as noted in my disclosure above, I used to get drunk on the yummy Big Blue Kool-Aid).  Now, this doesn’t mean that you are a “yes man” (or a “yes woman”).  It simply means it is logical for you to claim that market research, market perception, and market reality are in perfect alignment.

Likewise, if you are a customer, employee, or consultant for one of the “It Isn’t Easy Being Niche-y” (rather surprisingly, not an “official” Gartner Magic Quadrant term for the Niche Players), then obviously you have a somewhat vested interest in claiming that market research is from Mars, market perception is from Venus, and market reality is really no better than reality television.

And, if you are a customer, employee, or consultant for one of the “We are on the outside looking in, flipping both Gartner and their Magic Quadrant the bird for excluding us” (I think that you can figure out on your own whether or not that is an “official” Gartner Magic Quadrant term), then obviously you have a vested interest in saying that market research can “Kiss My ASCII!”

My only point is that your opinion of market research will obviously be influenced by what it says about your data quality tool. 

Therefore, should it really surprise anyone when, during the sales cycle, one of the High Five uses the Truly Awesome Syllogism:

“Well, of course, we say our data quality tool is awesome.
However, the Gartner Magic Quadrant also says our data quality tool is awesome.
Therefore, our data quality tool is Truly Awesome.”

Okay, so technically, that’s not even a syllogism—but who said any form of logical argument is ever used during a sales cycle?

On a more serious note, and to stop having too much fun at Gartner’s expense, they do advise against simply selecting vendors in their “Leaders quadrant” and instead always advise to select the vendor that is the better match for your specific requirements.


Features and Benefits: The Game Nobody Wins

As noted earlier, a features and benefits comparison is not only the most common technique used by prospects, but it is also the most common—if not the only—way that the vendors themselves position their so-called “competitive differentiation.”

The problem with this approach—and not just for data quality tools—is that there are far more similarities than differences to be found when comparing features and benefits. 

Practically every single data quality tool on the market today will include functionality for data profiling, data quality assessment, data standardization, data matching, data consolidation, data integration, data enrichment, and data quality monitoring.

Therefore, running down a checklist of features is like playing a game of Buzzword Bingo, or constantly playing Musical Chairs, but without removing any of the chairs in between rounds—in others words, the Features Game almost always ends in a tie.

So then next we play the Benefits Game, which is usually equally pointless because it comes down to silly arguments such as “our data matching engine is better than yours.”  This is the data quality tool vendor equivalent of:

Vendor D: “My Dad can beat up your Dad!”

Vendor Q: “Nah-huh!”

Vendor D: “Yah-huh!”

Vendor Q: “NAH-HUH!”

Vendor D: “YAH-HUH!”

Vendor Q: “NAH-HUH!”

Vendor D: “Yah-huh!  Stamp it!  No Erasies!  Quitsies!”

Vendor Q: “No fair!  You can’t do that!”

After both vendors have returned from their “timeout,” a slightly more mature approach is to run a vendor “bake-off” where the dueling data quality tools participate in a head-to-head competition processing a copy of the same data provided by the prospect. 

However, a bake-off often produces misleading results because the vendors—and not the prospect—perform the competition, making it mostly about vendor expertise, not OOBE-DQ.  Also, the data used rarely exemplifies the prospect’s data challenges.

If competitive differentiation based on features and benefits is a game that nobody wins, then what is the alternative?


The Golden Circle

The Golden Circle

I recently read the book Start with Why by Simon Sinek, which explains that “people don’t buy WHAT you do, they buy WHY you do it.” 

The illustration shows what Simon Sinek calls The Golden Circle.

WHY is your purpose—your driving motivation for action. 

HOW is your principles—specific actions that are taken to realize your Why. 

WHAT is your results—tangible ways in which you bring your Why to life. 

It’s a circle when viewed from above, but in reality it forms a megaphone for broadcasting your message to the marketplace. 

When you rely only on the approach of attempting to differentiate your data quality tool by discussing its features and benefits, you are focusing on only your WHAT, and absent your WHY and HOW, you sound just like everyone else to the marketplace.

When, as is often the case, nobody wins the Features and Benefits Game, a data quality tool sounds more like a commodity, which will focus the marketplace’s attention on aspects such as your price—and not on aspects such as your value.

Due to the considerable length of this blog post, I have been forced to greatly oversimplify the message of this book, which a future blog post will discuss in more detail.  I highly recommend the book (and no, I am not an affiliate).

At the very least, consider this question:

If there truly was one data quality tool on the market today that, without question, had the very best features and benefits, then why wouldn’t everyone simply buy that one? 

Of course your data quality tool has solid features and benefits—just like every other data quality tool does.

I believe that the hardest thing for our industry to accept is—the best technology hardly ever wins the sale. 

As most of the best salespeople will tell you, what wins the sale is when a relationship is formed between vendor and customer, a strategic partnership built upon a solid foundation of rapport, respect, and trust.

And that has more to do with WHY you would make a great partner—and less to do with WHAT your data quality tool does.


Do you believe in Magic (Quadrants)?

I Want To Believe

How much of an impact do you think market research has on the purchasing decision of a data quality tool?  How much do you think research affects both the perception and the reality of the data quality tool market?  How much do you think the features and benefits of a data quality tool affect the purchasing decision?

All perspectives on this debate are welcome without bias.  Therefore, please post a comment below.

PLEASE NOTE

Comments advertising your products and services (or bashing competitors) will not be approved.


Live-Tweeting: Data Governance

The term “live-tweeting” describes using Twitter to provide near real-time reporting from an event.  I live-tweet from the sessions I attend at industry conferences as well as interesting webinars.

Recently, I live-tweeted Successful Data Stewardship Through Data Governance, which was a data governance webinar featuring Marty Moseley of Initiate Systems and Jill Dyché of Baseline Consulting.

Instead of writing a blog post summarizing the webinar, I thought I would list my tweets with brief commentary.  My goal is to provide an example of this particular use of Twitter so you can decide its value for yourself.


As the webinar begins, Marty Moseley and Jill Dyché provide some initial thoughts on data governance:

Live-Tweets 1


Jill Dyché provides a great list of data governance myths and facts:

Live-Tweets 2


Jill Dyché provides some data stewardship insights:

Live-Tweets 3


As the webinar ends, Marty Moseley and Jill Dyché provide some closing thoughts about data governance and data quality:

Live-Tweets 4


Please Share Your Thoughts

If you attended the webinar, then you know additional material was presented.  Did my tweets do the webinar justice?  Did you follow along on Twitter during the webinar?  If you did not attend the webinar, then are these tweets helpful?

What are your thoughts in general regarding the pros and cons of live-tweeting? 


Related Posts

The following three blog posts are conference reports based largely on my live-tweets from the events:

Enterprise Data World 2009

TDWI World Conference Chicago 2009

DataFlux IDEAS 2009

We are the (IBM Information) Champions

Recently, I was honored to be named a 2009-2010 IBM Information Champion

From Vality Technology, through Ascential Software, and eventually with IBM, I have spent most of my career working with the data quality tool that is now known as IBM InfoSphere QualityStage. 

Throughout my time in Research and Development (as a Senior Software Engineer and a Development Engineer) and Professional Services (as a Principal Consultant and a Senior Technical Instructor), I was often asked to wear many hats for QualityStage – and not just because my balding head is distractingly shiny.

True champions are championship teams.  The QualityStage team (past and present) is the most remarkable group of individuals that I have ever had the great privilege to know, let alone the good fortune to work with.  Thank you all very, very much.


The IBM Information Champion Program

Previously known as the Data Champion Program, the IBM Information Champion Program honors individuals making outstanding contributions to the Information Management community. 

Technical communities, websites, books, conference speakers, and blogs all contribute to the success of IBM’s Information Management products.  But these activities don’t run themselves. 

Behind the scenes, there are dedicated and loyal individuals who put in their own time to run user groups, manage community websites, speak at conferences, post to forums, and write blogs.  Their time is uncompensated by IBM.

IBM honors the commitment of these individuals with a special designation — Information Champion — as a way of showing their appreciation for the time and energy these exceptional community members expend.

Information Champions are objective experts.  They have no official obligation to IBM. 

They simply share their opinions and years of experience with others in the field, and their work contributes greatly to the overall success of IBM Information Management.


We are the Champions

The IBM Information Champion Program has been expanded from the Data Management segment to all segments in Information Management, and now includes IBM Cognos, Enterprise Content Management, and InfoSphere. 

To read more about all of the Information Champions, please follow this link:  Profiles of the IBM Information Champions


IBM Website Links

IBM Information Champion Community Space

IBM Information Management User Groups

IBM developerWorks

IBM Information On Demand 2009 Global Conference

IBM Home Page (United States)


QualityStage Website Links

IBM Redbook for QualityStage

QualityStage Forum on IBM developerWorks

QualityStage Forum on DSXchange

LinkedIn Group for IBM InfoSphere QualityStage

DataQualityFirst

TDWI World Conference Chicago 2009

Founded in 1995, TDWI (The Data Warehousing Institute™) is the premier educational institute for business intelligence and data warehousing that provides education, training, certification, news, and research for executives and information technology professionals worldwide.  TDWI conferences always offer a variety of full-day and half-day courses taught in an objective, vendor-neutral manner.  The courses taught are designed for professionals and taught by in-the-trenches practitioners who are well known in the industry.


TDWI World Conference Chicago 2009 was held May 3-8 in Chicago, Illinois at the Hyatt Regency Hotel and was a tremendous success.  I attended as a Data Quality Journalist for the International Association for Information and Data Quality (IAIDQ).

I used Twitter to provide live reporting from the conference.  Here are my notes from the courses I attended: 


BI from Both Sides: Aligning Business and IT

Jill Dyché, CBIP, is a partner and co-founder of Baseline Consulting, a management and technology consulting firm that provides data integration and business analytics services.  Jill is responsible for delivering industry and client advisory services, is a frequent lecturer and writer on the business value of IT, and writes the excellent Inside the Biz blog.  She is the author of acclaimed books on the business value of information: e-Data: Turning Data Into Information With Data Warehousing and The CRM Handbook: A Business Guide to Customer Relationship Management.  Her latest book, written with Evan Levy, is Customer Data Integration: Reaching a Single Version of the Truth.

Course Quotes from Jill Dyché:

  • Five Critical Success Factors for Business Intelligence (BI):
    1. Organization - Build organizational structures and skills to foster a sustainable program
    2. Processes - Align both business and IT development processes that facilitate delivery of ongoing business value
    3. Technology - Select and build technologies that deploy information cost-effectively
    4. Strategy - Align information solutions to the company's strategic goals and objectives
    5. Information - Treat data as an asset by separating data management from technology implementation
  • Three Different Requirement Categories:
    1. What is the business need, pain, or problem?  What business questions do we need to answer?
    2. What data is necessary to answer those business questions?
    3. How do we need to use the resulting information to answer those business questions?
  • “Data warehouses are used to make business decisions based on data – so data quality is critical”
  • “Even companies with mature enterprise data warehouses still have data silos - each business area has its own data mart”
  • “Instead of pushing a business intelligence tool, just try to get people to start using data”
  • “Deliver a usable system that is valuable to the business and not just a big box full of data”


TDWI Data Governance Summit

Philip Russom is the Senior Manager of Research and Services at TDWI, where he oversees many of TDWI’s research-oriented publications, services, and events.  Prior to joining TDWI in 2005, he was an industry analyst covering BI at Forrester Research, as well as a contributing editor with Intelligent Enterprise and Information Management (formerly DM Review) magazines.

Summit Quotes from Philip Russom:

  • “Data Governance usually boils down to some form of control for data and its usage”
  • “Four Ps of Data Governance: People, Policies, Procedures, Process”
  • “Three Pillars of Data Governance: Compliance, Business Transformation, Business Integration”
  • “Two Foundations of Data Governance: Business Initiatives and Data Management Practices”
  • “Cross-functional collaboration is a requirement for successful Data Governance”


Becky Briggs, CBIP, CMQ/OE, is a Senior Manager and Data Steward for Airlines Reporting Corporation (ARC) and has 25 years of experience in data processing and IT - the last 9 in data warehousing and BI.  She leads the program team responsible for product, project, and quality management, business line performance management, and data governance/stewardship.

Summit Quotes from Becky Briggs:

  • “Data Governance is the act of managing the organization's data assets in a way that promotes business value, integrity, usability, security and consistency across the company”
  • Five Steps of Data Governance:
    1. Determine what data is required
    2. Evaluate potential data sources (internal and external)
    3. Perform data profiling and analysis on data sources
    4. Data Services - Definition, modeling, mapping, quality, integration, monitoring
    5. Data Stewardship - Classification, access requirements, archiving guidelines
  • “You must realize and accept that Data Governance is a program and not just a project”


Barbara Shelby is a Senior Software Engineer for IBM with over 25 years of experience holding positions of technical specialist, consultant, and line management.  Her global management and leadership positions encompassed network authentication, authorization application development, corporate business systems data architecture, and database development.

Summit Quotes from Barbara Shelby:

  • Four Common Barriers to Data Governance:
    1. Information - Existence of information silos and inconsistent data meanings
    2. Organization - Lack of end-to-end data ownership and organization cultural challenges
    3. Skill - Difficulty shifting resources from operational to transformational initiatives
    4. Technology - Business data locked in large applications and slow deployment of new technology
  • Four Key Decision Making Bodies for Data Governance:
    1. Enterprise Integration Team - Oversees the execution of CIO funded cross enterprise initiatives
    2. Integrated Enterprise Assessment - Responsible for the success of transformational initiatives
    3. Integrated Portfolio Management Team - Responsible for making ongoing business investment decisions
    4. Unit Architecture Review - Responsible for the IT architecture compliance of business unit solutions


Lee Doss is a Senior IT Architect for IBM with over 25 years of information technology experience.  He has a patent for process of aligning strategic capability for business transformation and he has held various positions including strategy, design, development, and customer support for IBM networking software products.

Summit Quotes from Lee Doss:

  • Five Data Governance Best Practices:
    1. Create a sense of urgency that the organization can rally around
    2. Start small, grow fast...pick a few visible areas to set an example
    3. Sunset legacy systems (application, data, tools) as new ones are deployed
    4. Recognize the importance of organization culture…this will make or break you
    5. Always, always, always – Listen to your customers


Kevin Kramer is a Senior Vice President and Director of Enterprise Sales for UMB Bank and is responsible for development of sales strategy, sales tool development, and implementation of enterprise-wide sales initiatives.

Summit Quotes from Kevin Kramer:

  • “Without Data Governance, multiple sources of customer information can produce multiple versions of the truth”
  • “Data Governance helps break down organizational silos and shares customer data as an enterprise asset”
  • “Data Governance provides a roadmap that translates into best practices throughout the entire enterprise”


Kanon Cozad is a Senior Vice President and Director of Application Development for UMB Bank and is responsible for overall technical architecture strategy and oversees information integration activities.

Summit Quotes from Kanon Cozad:

  • “Data Governance identifies business process priorities and then translates them into enabling technology”
  • “Data Governance provides direction and Data Stewardship puts direction into action”
  • “Data Stewardship identifies and prioritizes applications and data for consolidation and improvement”


Jill Dyché, CBIP, is a partner and co-founder of Baseline Consulting, a management and technology consulting firm that provides data integration and business analytics services.  (For Jill's complete bio, please see above).

Summit Quotes from Jill Dyché:

  • “The hard part of Data Governance is the data
  • “No data will be formally sanctioned unless it meets a business need”
  • “Data Governance focuses on policies and strategic alignment”
  • “Data Management focuses on translating defined polices into executable actions”
  • “Entrench Data Governance in the development environment”
  • “Everything is customer data – even product and financial data”


Data Quality Assessment - Practical Skills

Arkady Maydanchik is a co-founder of Data Quality Group, a recognized practitioner, author, and educator in the field of data quality and information integration.  Arkady's data quality methodology and breakthrough ARKISTRA technology were used to provide services to numerous organizations.  Arkady is the author of the excellent book Data Quality Assessment, a frequent speaker at various conferences and seminars, and a contributor to many journals and online publications.  Data quality curriculum by Arkady Maydanchik can be found at eLearningCurve.

Course Quotes from Arkady Maydanchik:

  • “Nothing is worse for data quality than desperately trying to fix it during the last few weeks of an ETL project”
  • “Quality of data after conversion is in direct correlation with the amount of knowledge about actual data”
  • “Data profiling tools do not do data profiling - it is done by data analysts using data profiling tools”
  • “Data Profiling does not answer any questions - it helps us ask meaningful questions”
  • “Data quality is measured by its fitness to the purpose of use – it's essential to understand how data is used”
  • “When data has multiple uses, there must be data quality rules for each specific use”
  • “Effective root cause analysis requires not stopping after the answer to your first question - Keep asking: Why?”
  • “The central product of a Data Quality Assessment is the Data Quality Scorecard”
  • “Data quality scores must be both meaningful to a specific data use and be actionable”
  • “Data quality scores must estimate both the cost of bad data and the ROI of data quality initiatives”


Modern Data Quality Techniques in Action - A Demonstration Using Human Resources Data

Gian Di Loreto formed Loreto Services and Technologies in 2004 from the client services division of Arkidata Corporation.  Loreto Services provides data cleansing and integration consulting services to Fortune 500 companies.  Gian is a classically trained scientist - he received his PhD in elementary particle physics from Michigan State University.

Course Quotes from Gian Di Loreto:

  • “Data Quality is rich with theory and concepts – however it is not an academic exercise, it has real business impact”
  • “To do data quality well, you must walk away from the computer and go talk with the people using the data”
  • “Undertaking a data quality initiative demands developing a deeper knowledge of the data and the business”
  • “Some essential data quality rules are ‘hidden’ and can only be discovered by ‘clicking around’ in the data”
  • “Data quality projects are not about systems working together - they are about people working together”
  • “Sometimes, data quality can be ‘good enough’ for source systems but not when integrated with other systems”
  • “Unfortunately, no one seems to care about bad data until they have it”
  • “Data quality projects are only successful when you understand the problem before trying to solve it”


Mark Your Calendar

TDWI World Conference San Diego 2009 - August 2-7, 2009.

TDWI World Conference Orlando 2009 - November 1-6, 2009.

TDWI World Conference Las Vegas 2010 - February 21-26, 2010.