Recently Read is an OCDQ regular segment. Each entry provides links to blog posts, articles, books, and other material I found interesting enough to share. Please note “recently read” is literal – therefore what I share wasn't necessarily recently published.
Data Quality
For simplicity, “Data Quality” also includes Data Governance, Master Data Management, and Business Intelligence.
Data Quality Blog Roundup - November 2009 Edition – Dylan Jones at Data Quality Pro always provides a great collection of the previous month's best blog posts, which covers most of the my “recently reads” for data quality.
The value of Christmas cards – In this Data Value Talk blog post from Human Inference, we learn about how sending Christmas cards can optimize your data quality.
Santa Quality – Yes, Virginia, there is a Santa Claus—as well as a Saint Nicholas, a Père Noël, a Weihnachtsmann, and a Julemand. In this blog post, Henrik Liliendahl Sørensen explains some ho-ho-holiday data quality issues.
Some TLC for Your Data – Data really needs some tender loving care. Daniel Gent explains in his latest blog post.
Determining data quality is the first key step – In the second part of a blog series on data migration, James Standen explains that a data migration project will be required to actually improve data quality at the same time, and therefore it is really two projects in one. The post contains the great line: “data quality sense tingling.”
For simplicity, “Social Media” also includes Blogging, Writing, Social Networking, and Online Marketing.
Beware Social Media Snake Oil – In this BusinessWeek article, Stephen Baker examines the value of wikis, social networks, and blogs, and the hordes of “experts” promoting the hype that may obscure the real potential of social media.
Measuring Social Media Marketing – Chris Brogan provides a nice counterpoint to some of the (definitely legitimate) issues raised in Stephen's Baker's BusinessWeek article (see above).
An eclectic list of articles, blog posts, and other “non-data quality, non-social media, but still awesome” stuff.
The Greatest Book Of All Time? – Josh Hanagarne (a.k.a. the “World’s Strongest Librarian”) recently reviewed a book he received from Ethan. Josh has a simple philosophy of life — “Don’t make anyone’s day worse” — if you are having a bad day (like I was the day I found this), then check this out.
Cute Apple parody from The Sun – Rob Beschizza on Boing Boing shares a great one minute video of a recent commercial from The Sun about “The UK's best handheld for 40 years.”
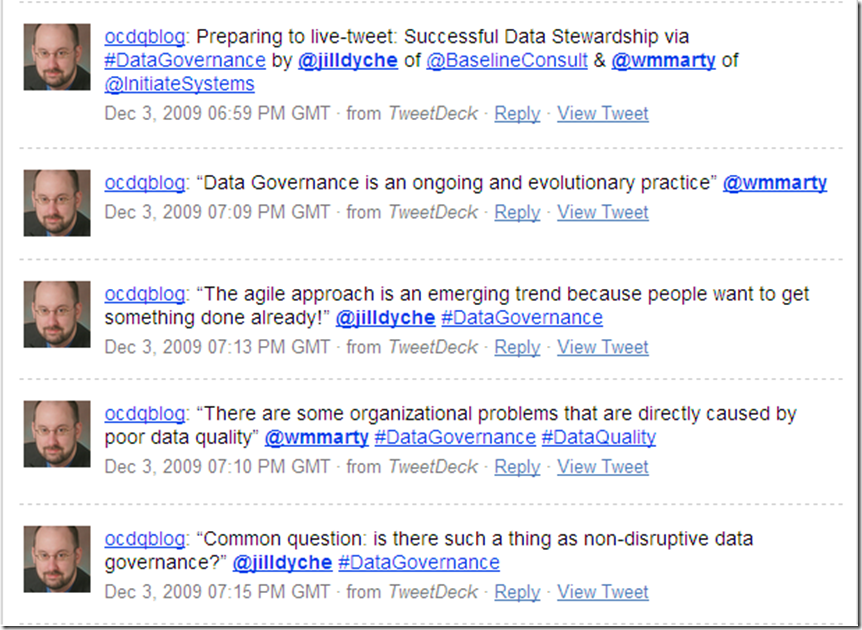
The term “live-tweeting” describes using Twitter to provide near real-time reporting from an event. I live-tweet from the sessions I attend at industry conferences as well as interesting webinars.
Instead of writing a blog post summarizing the webinar, I thought I would list my tweets with brief commentary. My goal is to provide an example of this particular use of Twitter so you can decide its value for yourself.
As the webinar begins, Marty Moseley and Jill Dyché provide some initial thoughts on data governance:
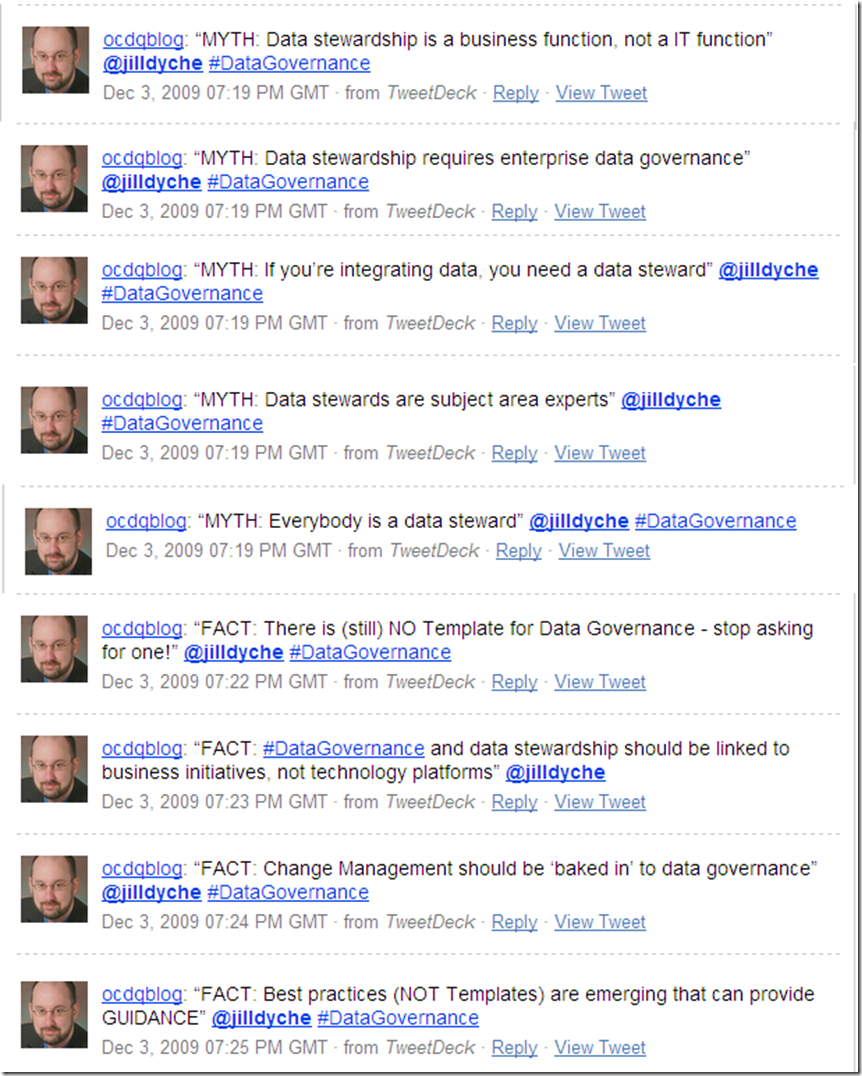
Jill Dyché provides a great list of data governance myths and facts:
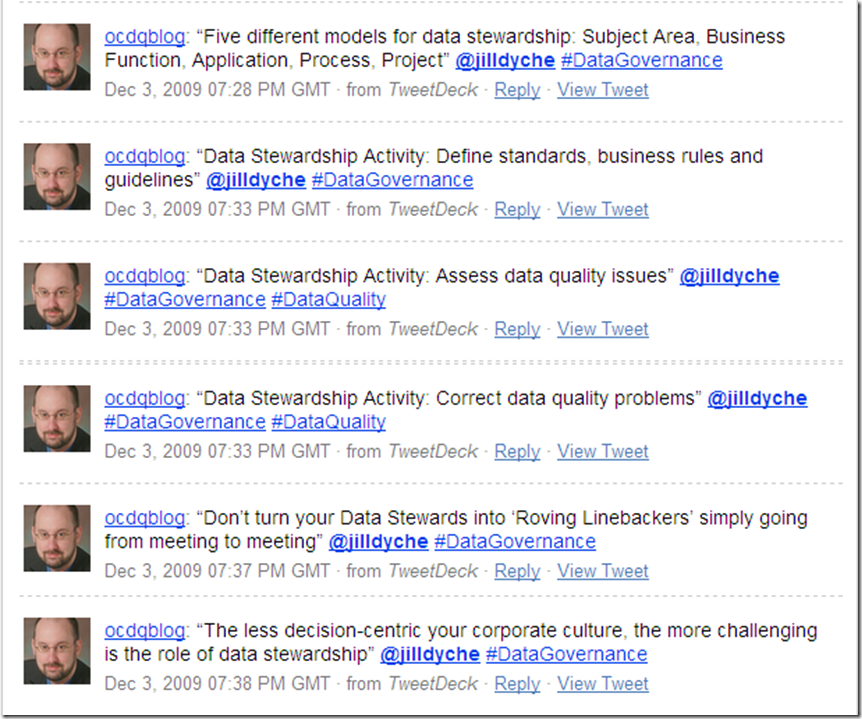
Jill Dyché provides some data stewardship insights:
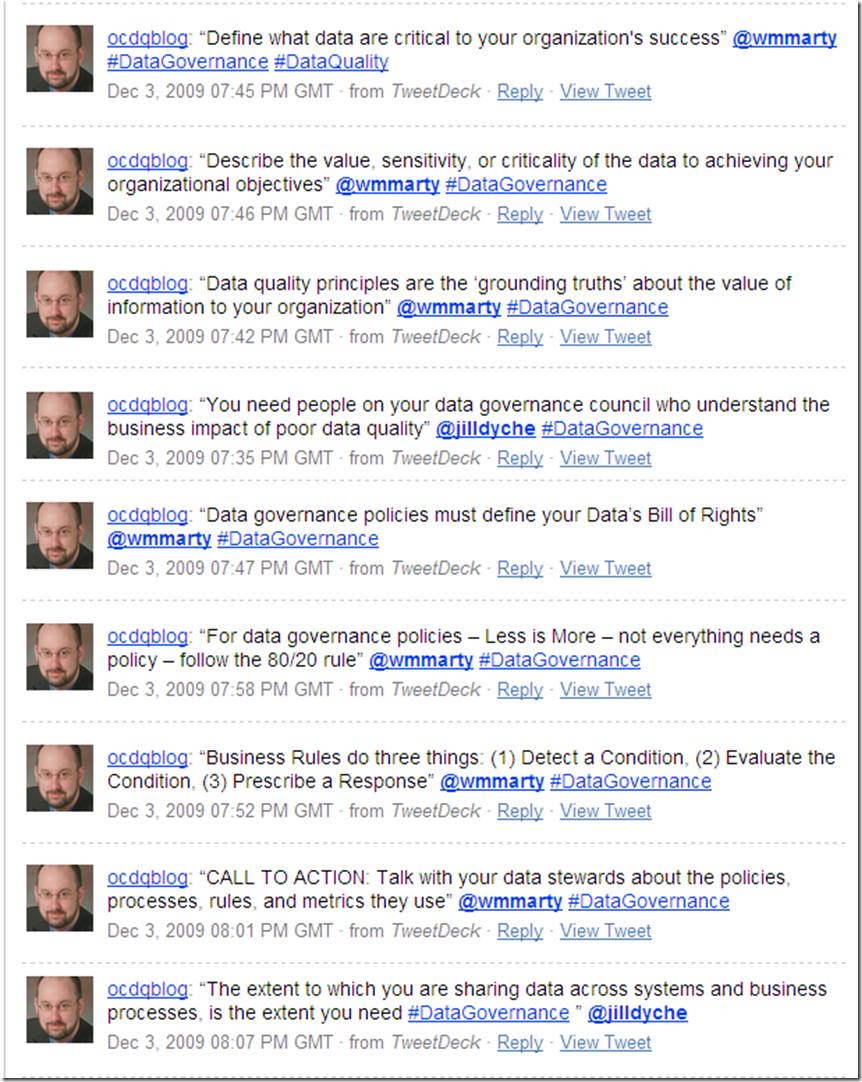
As the webinar ends, Marty Moseley and Jill Dyché provide some closing thoughts about data governance and data quality:
Please Share Your Thoughts
If you attended the webinar, then you know additional material was presented. Did my tweets do the webinar justice? Did you follow along on Twitter during the webinar? If you did not attend the webinar, then are these tweets helpful?
What are your thoughts in general regarding the pros and cons of live-tweeting?
Related Posts
The following three blog posts are conference reports based largely on my live-tweets from the events:
I am sick and tired of hearing people talk about how data quality (DQ) is not sexy.
I was talking with my friend J.T. the other day and he told me I simply needed to remind people data quality has always been sexy. Sometimes, people just have a tendency to forget.
J.T. told me:
“You know what you gotta do J.H.? You gotta bring DQ Sexy back.”
True dat, J.T.
I'm Bringing DQ Sexy Back
I’m bringing DQ Sexy back
All you naysayers, watch how I attack
I think your data’s special, why does your quality lack?
Grant me some access, and I’ll pick up the slack
Dirty data – you see the problems everywhere
Let me be your data cleanser, and baby, I'll be there
We'll whip the Business Process if it misbehaves
But just remember – trying to be perfect – it's not the way
I’m bringing DQ Sexy back
Them non-team players don’t know how to act
Let our collaboration get us back on track
Working together, we'll make the right impact
Look at that data – it's your 'prise asset Treat it well, and all your business needs will be met
Understanding it will really make you smile To get started, you really need to profile
There's no need for you to be afraid – come on Go ahead – get your data freak on
I’m bringing DQ Sexy back
Any non-believers left? Don't make me give you a smack
If you have data, you'd better watch out for what it lacks
'Cause quality is what it needs – and that’s a fact
Understanding your data is essential to using it effectively and improving its quality – and to achieve these goals, there is simply no substitute for data analysis. This post is the conclusion of a vendor-neutral series on the methodology of data profiling.
Data profiling can help you perform essential analysis such as:
Provide a reality check for the perceptions and assumptions you may have about the quality of your data
Verify your data matches the metadata that describes it
Identify different representations for the absence of data (i.e., NULL and other missing values)
Identify potential default values
Identify potential invalid values
Check data formats for inconsistencies
Prepare meaningful questions to ask subject matter experts
Data profiling can also help you with many of the other aspects of domain, structural and relational integrity, as well as determining functional dependencies, identifying redundant storage, and other important data architecture considerations.
Adventures in Data Profiling
This series was carefully designed as guided adventures in data profiling in order to provide the necessary framework for demonstrating and discussing the common functionality of data profiling tools and the basic methodology behind using one to perform preliminary data analysis.
In order to narrow the scope of the series, the scenario used was a customer data source for a new data quality initiative had been made available to an external consultant with no prior knowledge of the data or its expected characteristics. Additionally, business requirements had not yet been documented, and subject matter experts were not currently available.
This series did not attempt to cover every possible feature of a data profiling tool or even every possible use of the features that were covered. Both the data profiling tool and data used throughout the series were fictional. The “screen shots” were customized to illustrate concepts and were not modeled after any particular data profiling tool.
This post summarizes the lessons learned throughout the series, and is organized under three primary topics:
Counts and Percentages
Values and Formats
Drill-down Analysis
Counts and Percentages
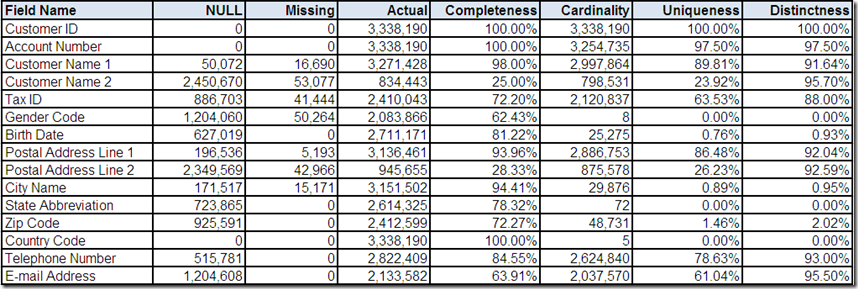
One of the most basic features of a data profiling tool is the ability to provide counts and percentages for each field that summarize its content characteristics:
NULL – count of the number of records with a NULL value
Missing – count of the number of records with a missing value (i.e., non-NULL absence of data, e.g., character spaces)
Actual – count of the number of records with an actual value (i.e., non-NULL and non-Missing)
Completeness – percentage calculated as Actual divided by the total number of records
Cardinality – count of the number of distinct actual values
Uniqueness – percentage calculated as Cardinality divided by the total number of records
Distinctness – percentage calculated as Cardinality divided by Actual
Completeness and uniqueness are particularly useful in evaluating potential key fields and especially a single primary key, which should be both 100% complete and 100% unique. In Part 2, Customer ID provided an excellent example.
Distinctness can be useful in evaluating the potential for duplicate records. In Part 6, Account Number and Tax ID were used as examples. Both fields were less than 100% distinct (i.e., some distinct actual values occurred on more than one record). The implied business meaning of these fields made this an indication of possible duplication.
Data profiling tools generate other summary statistics including: minimum/maximum values, minimum/maximum field sizes, and the number of data types (based on analyzing the values, not the metadata). Throughout the series, several examples were provided, especially in Part 3 during the analysis of Birth Date, Telephone Number and E-mail Address.
Values and Formats
In addition to counts, percentages, and other summary statistics, a data profiling tool generates frequency distributions for the unique values and formats found within the fields of your data source.
A frequency distribution of unique values is useful for:
Fields with an extremely low cardinality, indicating potential default values (e.g., Country Code in Part 4)
Fields with a relatively low cardinality (e.g., Gender Code in Part 2)
Fields with a relatively small number of known valid values (e.g., State Abbreviation in Part 4)
A frequency distribution of unique formats is useful for:
Fields expected to contain a single data type and/or length (e.g., Customer ID in Part 2)
Fields with a relatively limited number of known valid formats (e.g., Birth Date in Part 3)
Fields with free-form values and a high cardinality (e.g., Customer Name 1 and Customer Name 2 in Part 7)
Cardinality can play a major role in deciding whether you want to be shown values or formats since it is much easier to review all of the values when there are not very many of them. Alternatively, the review of high cardinality fields can also be limited to the most frequently occurring values, as we saw throughout the series (e.g., Telephone Number in Part 3).
Some fields can also be analyzed using partial values (e.g., in Part 3, Birth Year was extracted from Birth Date) or a combination of values and formats (e.g., in Part 6, Account Number had an alpha prefix followed by all numbers).
Free-form fields are often easier to analyze as formats constructed by parsing and classifying the individual values within the field. This analysis technique is often necessary since not only is the cardinality of free-form fields usually very high, but they also tend to have a very high distinctness (i.e., the exact same field value rarely occurs on more than one record).
Additionally, the most frequently occurring formats for free-form fields will often collectively account for a large percentage of the records with an actual value in the field. Examples of free-form field analysis were the focal points of Part 5 and Part 7.
We also saw examples of how valid values in a valid format can have an invalid context (e.g., in Part 3, Birth Date values set in the future), as well as how valid field formats can conceal invalid field values (e.g., Telephone Number in Part 3).
Part 3 also provided examples (in both Telephone Number and E-mail Address) of how you should not mistake completeness (which as a data profiling statistic indicates a field is populated with an actual value) for an indication the field is complete in the sense that its value contains all of the sub-values required to be considered valid.
Drill-down Analysis
A data profiling tool will also provide the capability to drill-down on its statistical summaries and frequency distributions in order to perform a more detailed review of records of interest. Drill-down analysis will often provide useful data examples to share with subject matter experts.
Performing a preliminary analysis on your data prior to engaging in these discussions better facilitates meaningful dialogue because real-world data examples better illustrate actual data usage. As stated earlier, understanding your data is essential to using it effectively and improving its quality.
Various examples of drill-down analysis were used throughout the series. However, drilling all the way down to the record level was shown in Part 2 (Gender Code), Part 4 (City Name), and Part 6 (Account Number and Tax ID).
Conclusion
Fundamentally, this series posed the following question: What can just your analysis of data tell you about it?
Data profiling is typically one of the first tasks performed on a data quality initiative. I am often told to delay data profiling until business requirements are documented and subject matter experts are available to answer my questions.
I always disagree – and begin data profiling as soon as possible.
I can do a better job of evaluating business requirements and preparing for meetings with subject matter experts after I have spent some time looking at data from a starting point of blissful ignorance and curiosity.
Ultimately, I believe the goal of data profiling is not to find answers, but instead, to discover the right questions.
Discovering the right questions is a critical prerequisite for effectively discussing data usage, relevancy, standards, and the metrics for measuring and improving quality. All of which are necessary in order to progress from just profiling your data, to performing a full data quality assessment (which I will cover in a future series on this blog).
A data profiling tool can help you by automating some of the grunt work needed to begin your analysis. However, it is important to remember that the analysis itself can not be automated – you need to review the statistical summaries and frequency distributions generated by the data profiling tool and more important – translate your analysis into meaningful reports and questions to share with the rest of your team.
Always remember that well performed data profiling is both a highly interactive and a very iterative process.
Thank You
I want to thank you for providing your feedback throughout this series.
As my fellow Data Gazers, you provided excellent insights and suggestions via your comments.
The primary reason I published this series on my blog, as opposed to simply writing a whitepaper or a presentation, was because I knew our discussions would greatly improve the material.
I hope this series proves to be a useful resource for your actual adventures in data profiling.
Recently Read is an OCDQ regular segment. Each entry provides links to blog posts, articles, books, and other material I found interesting enough to share. Please note “recently read” is literal – therefore what I share wasn't necessarily recently published.
Data Quality Blog Posts
For simplicity, “Data Quality” also includes Data Governance, Master Data Management, and Business Intelligence.
What’s in an eMail Address? – Henrik Liliendahl Sørensen examines different types and uses for e-mail address as a master data attribute, as well as issues relating to real-world duplication and multi-channel marketing and sales.
Are You Really Ready for Data Governance? – Jill Dyché explains the difference between disruptive and non-disruptive data governance, and why you're really ready for data governance only when you're really ready to get out of your comfort zone.
With Gratitude – An excellent Thanksgiving-themed post from Dan Power.
Data Governance at the Front Line – Charles Blyth explains how pushing data governance to front line business processes and applications must be the ultimate goal. The post includes a description of the five front line resource categories.
Social Media Blog Posts
For simplicity, “Social Media” also includes Blogging, Social Networking, and Online Marketing.
Blogging Business Models – the actual title of this ProBlogger guest post by Kelly Diels is much longer and more enticing to click on. This post contains great advice and useful links about how, if you want to make blogging a business (i.e., if you want to make money from blogging), then you really need a business model.
Social Networking in the Workplace – Phil Simon discusses the value proposition of social networking in the workplace. This great post is made even better by the excellent comments it received (and not at all diminished by my comment).
The Serendipity Engine – Chris Brogan's keynote speech from the Web 2.0 Expo – great ten minute YouTube video.
An eclectic list of quotes from some recently read (and/or simply my favorite) books.
From The Wisdom of Crowds by James Surowiecki – “Refuse to allow the merit of an idea to be determined by the status of the person advocating it.”
From Purple Cow by Seth Godin – “We mistakenly believe that criticism leads to failure.”
From How We Decide by Jonah Lehrer – “The best decision-makers don't despair. Instead, they become students of error, determined to learn from what went wrong.”
From The Whuffie Factor by Tara Hunt – “Whuffie is the residual outcome—the currency—of your reputation. You lose or gain it based on positive or negative actions, your contributions to the community, and what people think of you.”
From Trust Agents by Chris Brogan and Julien Smith – “You accrue social capital as a side benefit of doing good, but doing good by itself is its own reward.”
Photo via Flickr (Creative Commons License) by: ella_marie
Today is Thanksgiving Day, which is a United States holiday with a long and varied history. The most consistent themes remain family and friends gathering together to share a large meal and express their gratitude.
This is the fourth entry in my ongoing series for expressing my gratitude to my readers for their truly commendable comments on my blog posts. Receiving comments is the most rewarding aspect of my blogging experience. Although I am truly grateful to all of my readers, I am most grateful to my commenting readers.
“Data quality issues probably occur on some scale in most companies every day. As long as you qualify what is and isn't a data quality issue, this gets back to what the company thinks is an acceptable level of data quality.
I've always advocated aggregating data quality scores to form business metrics. For example, what data quality metrics would you combine to ensure that customers can always be contacted in case of an upgrade, recall or new product offering? If you track the aggregation, it gives you more of a business feel.”
“Back when I was with the phone company I was (by default) the guardian of the definition of a 'Customer'. Basically I think they asked for volunteers to step forward and I was busy tying my shoelace when the other 11,000 people in the company as one entity took a large step backwards.
I found that the best way to get a definition of a customer was to lock the relevant stakeholders in a room and keep asking 'What' and 'Why'.
My 'data modeling' methodology was simple. Find out what the things were that were important to the business operation, define each thing in English without a reference to itself, and then we played the 'Yes/No Game Show' to figure out how that entity linked to other things and what the attributes of that thing were.
Much to IT's confusion, I insisted that the definition needed to be a living thing, not carved in two stone tablets we'd lug down from on top of the mountain.
However, because of the approach that had been taken we found that when new requirements were raised (27 from one stakeholder), the model accommodated all of them either through an expansion of a description or the addition of a piece of reference data to part of the model.
Fast-forward a few months from the modeling exercise. I was asked by IT to demo the model to a newly acquired subsidiary. It was a significantly different business. I played the 'Yes/No Game Show' with them for a day. The model fitted their needs with just a minor tweak.
The IT team from the subsidiary wanted to know how had I gone about normalizing the data to come up with the model, which is kind of like cutting up a perfectly good apple pie to find out how what an apple is and how to make pastry.
What I found about the 'Yes/No Game Show' approach was that it made people open up their thinking a bit, but it took some discipline and perseverance on my part to keep asking what and why. Luckily, having spent most of the previous few years trying to get these people to think seriously about data quality they already thought I was a moron so they were accommodating to me.
A key learning for me out of the whole thing is that, even if you are doing a data management exercise for a part of a larger business, you need to approach it in a way that can be evolved and continuously improved to ensure quality across the entire organization.
Also, it highlighted the fallacy of assuming that a company can only have one kind of customer.”
“I recently attended a conference and sat in on a panel that discussed some of the future trends, such as cloud computing. It was a great discussion, highly polarized, and as I came home I thought about how far we've come as a profession but more importantly, how much more there is to do.
The reality is that the world is changing, the volumes of data held by businesses are immense and growing exponentially, our desire for new forms of information delivery insatiable, and the opportunities for innovation boundless.
I really believe we're not innovating as an industry anything like we should be. The cloud, as an example, offers massive opportunities for a range of data quality services but I've certainly not read anything in the media or press that indicates someone is capitalizing on this.
There are a few recent data quality technology innovations which have caught my eye, but I also think there is so much more vendors should be doing.
On the personal side of the profession, I think online education is where we're headed. The concept of localized training is now being replaced by online learning. With the Internet you can now train people on every continent, so why aren't more people going down this route?
I find it incredibly ironic when I speak to data quality specialists who admit that 'they don't have the first clue about all this social media stuff.' This is the next generation of information management, it's here right now, they should be embracing it. I think if you're a 'guru' author, trainer or consultant you need to think of new ways to engage with your clients/trainees using the tools available.
What worries me is that the growth of information doesn't match the maturity and growth of our profession. For example, we really need more people who can articulate the value of what we can offer.
Ted Friedman made a great point on Twitter recently when he talked about how people should stop moaning about executives that 'don't get it' and instead focus on improving ways to demonstrate the value of data quality improvement.
Just because we've come a long way doesn't mean we know it all, there is still a hell of a long way to go.”
Thanks for giving your comments
Thank you very much for giving your comments and sharing your perspectives with our collablogaunity. Since there have been so many commendable comments, please don't be offended if your commendable comment hasn't been featured yet.
Please keep on commenting and stay tuned for future entries in the series.
In the book, Fisher explains that one of the biggest mistakes organizations make is not viewing their data as a corporate asset. This common misconception often prevents data quality from being rightfully viewed a critical priority.
Data quality is misperceived to be an activity performed just for the sake of improving data. When in fact, data quality is an activity performed for the sake of improving business processes.
“Better data leads to better decisions,” explains Fisher, “which ultimately leads to better business. Therefore, the very success of your organization is highly dependent on the quality of your data.”
This post is involved in a good-natured contest (i.e., a blog-bout) with two additional bloggers: Henrik Liliendahl Sørensen and Charles Blyth. Our contest is a Blogging Olympics of sorts, with the United States, Denmark, and England competing for the Gold, Silver, and Bronze medals in an event we are calling “Three Single Versions of a Shared Version of the Truth.”
Please take the time to read all three posts and then vote for who you think has won the debate (see poll below). Thanks!
The “Point of View” Paradox
In the early 20th century, within his Special Theory of Relativity, Albert Einstein introduced the concept that space and time are interrelated entities forming a single continuum, and therefore the passage of time can be a variable that could change for each individual observer.
One of the many brilliant insights of special relativity was that it could explain why different observers can make validly different observations – it was a scientifically justifiable matter of perspective.
It was Einstein's apprentice, Obi-Wan Kenobi (to whom Albert explained “Gravity will be with you, always”), who stated:
“You're going to find that many of the truths we cling to depend greatly on our own point of view.”
The Data-Information Continuum
In the early 21st century, within his popular blog post The Data-Information Continuum, Jim Harris introduced the concept that data and information are interrelated entities forming a single continuum, and that speaking of oneself in the third person is the path to the dark side.
I use the Dragnet definition for data – it is “just the facts” collected as an abstract description of the real-world entities that the enterprise does business with (e.g., customers, vendors, suppliers).
Although a common definition for data quality is fitness for the purpose of use, the common challenge is that data has multiple uses – each with its own fitness requirements. Viewing each intended use as the information that is derived from data, I define informationas data in use or data in action.
Quality within the Data-Information Continuum has both objective and subjective dimensions. Data's quality is objectively measured separate from its many uses, while information's quality is subjectively measured according to its specific use.
Objective Data Quality
Data quality standards provide a highest common denominator to be used by all business units throughout the enterprise as an objective data foundation for their operational, tactical, and strategic initiatives.
In order to lay this foundation, raw data is extracted directly from its sources, profiled, analyzed, transformed, cleansed, documented and monitored by data quality processes designed to provide and maintain universal data sources for the enterprise's information needs.
At this phase of the architecture, the manipulations of raw data must be limited to objective standards and not be customized for any subjective use. From this perspective, data is now fit to serve (as at least the basis for) each and every purpose.
Subjective Information Quality
Information quality standards (starting from the objective data foundation) are customized to meet the subjective needs of each business unit and initiative. This approach leverages a consistent enterprise understanding of data while also providing the information necessary for day-to-day operations.
But please understand: customization should not be performed simply for the sake of it. You must always define your information quality standards by using the enterprise-wide data quality standards as your initial framework.
Whenever possible, enterprise-wide standards should be enforced without customization. The key word within the phrase “subjective information quality standards” is standards — as opposed to subjective, which can quite often be misinterpreted as “you can do whatever you want.” Yes you can – just as long as you have justifiable business reasons for doing so.
This approach to implementing information quality standards has three primary advantages. First, it reinforces a consistent understanding and usage of data throughout the enterprise. Second, it requires each business unit and initiative to clearly explain exactly how they are using data differently from the rest of your organization, and more important, justify why. Finally, all deviations from enterprise-wide data quality standards will be fully documented.
The “One Lie Strategy”
A common objection to separating quality standards into objective data quality and subjective information quality is the enterprise's significant interest in creating what is commonly referred to as a “Single Version of the Truth.”
“A fiendishly attractive concept is...'a single version of the truth'...the logic is compelling...unfortunately, there is no single version of the truth.
For all important data, there are...too many uses, too many viewpoints, and too much nuance for a single version to have any hope of success.
This does not imply malfeasance on anyone's part; it is simply a fact of life.
Getting everyone to work from a single version of the truth may be a noble goal, but it is better to call this the 'one lie strategy' than anything resembling truth.”
Beyond a “Single Version of the Truth”
In the classic 1985 film Mad Max Beyond Thunderdome, the title character arrives in Bartertown, ruled by the evil Auntie Entity, where people living in the post-apocalyptic Australian outback go to trade for food, water, weapons, and supplies. Auntie Entity forces Mad Max to fight her rival Master Blaster to the death within a gladiator-like arena known as Thunderdome, which is governed by one simple rule:
“Two men enter, one man leaves.”
I have always struggled with the concept of creating a “Single Version of the Truth.” I imagine all of the key stakeholders from throughout the enterprise arriving in Corporatetown, ruled by the Machiavellian CEO known only as Veritas, where all business units and initiatives must go to request funding, staffing, and continued employment. Veritas forces all of them to fight their Master Data Management rivals within a gladiator-like arena known as Meetingdome, which is governed by one simple rule:
“Many versions of the truth enter, a Single Version of the Truth leaves.”
For any attempted “version of the truth” to truly be successfully implemented within your organization, it must take into account both the objective and subjective dimensions of quality within the Data-Information Continuum.
Both aspects of this shared perspective of quality must be incorporated into a “Shared Version of the Truth” that enforces a consistent enterprise understanding of data, but that also provides the information necessary to support day-to-day operations.
The Data-Information Continuum is governed by one simple rule:
“All validly different points of view must be allowed to enter,
In order for an all encompassing Shared Version of the Truth to be achieved.”
You are the Judge
This post is involved in a good-natured contest (i.e., a blog-bout) with two additional bloggers: Henrik Liliendahl Sørensen and Charles Blyth. Our contest is a Blogging Olympics of sorts, with the United States, Denmark, and England competing for the Gold, Silver, and Bronze medals in an event we are calling “Three Single Versions of a Shared Version of the Truth.”
Please take the time to read all three posts and then vote for who you think has won the debate. A link to the same poll is provided on all three blogs. Therefore, wherever you choose to cast your vote, you will be able to view an accurate tally of the current totals.
The poll will remain open for one week, closing at midnight on November 19 so that the “medal ceremony” can be conducted via Twitter on Friday, November 20. Additionally, please share your thoughts and perspectives on this debate by posting a comment below. Your comment may be copied (with full attribution) into the comments section of all of the blogs involved in this debate.
World Quality Day was established by the United Nations in 1990 as a focal point for the quality management profession and as a celebration of the contribution that quality makes to the growth and prosperity of nations and organizations. The goal of World Quality Day is to raise awareness of how quality approaches (including data quality best practices) can have a tangible effect on business success, as well as contribute towards world-wide economic prosperity.
IAIDQ
The International Association for Information and Data Quality (IAIDQ) was chartered in January 2004 and is a not-for-profit, vendor-neutral professional association whose purpose is to create a world-wide community of people who desire to reduce the high costs of low quality information and data by applying sound quality management principles to the processes that create, maintain and deliver data and information.
Since 2007 the IAIDQ has celebrated World Quality Day as a springboard for improvement and a celebration of successes. Please join us to celebrate World Quality Day by participating in our interactive webinar in which the Board of Directors of the IAIDQ will share with you stories and experiences to promote data quality improvements within your organization.
In my recent Data Quality Pro article The Future of Information and Data Quality, I reported on the IAIDQ Ask The Expert Webinar with co-founders Larry English and Tom Redman, two of the industry pioneers for data quality and two of the most well-known data quality experts.
Data Quality Expert
As World Quality Day 2009 approaches, my personal reflections are focused on what the title data quality expert has meant in the past, what it means today, and most important, what it will mean in the future.
With over 15 years of professional services and application development experience, I consider myself to be a data quality expert. However, my experience is paltry by comparison to English, Redman, and other industry luminaries such as David Loshin, to use one additional example from many.
Experience is popularly believed to be the path that separates knowledge from wisdom, which is usually accepted as another way of defining expertise.
Oscar Wilde once wrote that “experience is simply the name we give our mistakes.” I agree. I have found that the sooner I can recognize my mistakes, the sooner I can learn from the lessons they provide, and hopefully prevent myself from making the same mistakes again.
The key is early detection. As I gain experience, I gain an improved ability to more quickly recognize my mistakes and thereby expedite the learning process.
James Joyce wrote that “mistakes are the portals of discovery” and T.S. Eliot wrote that “we must not cease from exploration and the end of all our exploring will be to arrive where we began and to know the place for the first time.”
What I find in the wisdom of these sages is the need to acknowledge the favor our faults do for us. Therefore, although experience is the path that separates knowledge from wisdom, the true wisdom of experience is the wisdom of failure.
As Jonah Lehrer explained: “Becoming an expert just takes time and practice. Once you have developed expertise in a particular area, you have made the requisite mistakes.”
But expertise in any discipline is more than simply an accumulation of mistakes and birthdays. And expertise is not a static state that once achieved, allows you to simply rest on your laurels.
In addition to my real-world experience working on data quality initiatives for my clients, I also read all of the latest books, articles, whitepapers, and blogs, as well as attend as many conferences as possible.
The Times They Are a-Changin'
Much of the discussion that I have heard regarding the future of the data quality profession has been focused on the need for the increased maturity of both practitioners and organizations. Although I do not dispute this need, I am concerned about the apparent lack of attention being paid to how fast the world around us is changing.
Rapid advancements in technology, coupled with the meteoric rise of the Internet and social media (blogs, wikis, Twitter, Facebook, LinkedIn, etc.) has created an amazing medium that is enabling people separated by vast distances and disparate cultures to come together, communicate, and collaborate in ways few would have thought possible just a few decades ago.
I don't believe that it is an exaggeration to state that we are now living in an age where the contrast between the recent past and the near future is greater than perhaps it has ever been in human history. This brave new world has such people and technology in it, that practically every new day brings the possibility of another quantum leap forward.
Although it has been argued by some that the core principles of data quality management are timeless, I must express my doubt. The daunting challenges of dramatically increasing data volumes and the unrelenting progress of cloud computing, software as a service (SaaS), and mobile computing architectures, would appear to be racing toward a high-speed collision with our time-tested (but time-consuming to implement properly) data quality management principles.
The times they are indeed changing and I believe we must stop using terms like Six Sigma and Kaizen as if they were a shibboleth. If these or any other disciplines are to remain relevant, then we must honestly assess them in the harsh and unforgiving light of our brave new world that is seemingly changing faster than the speed of light.
Expertise is not static. Wisdom is not timeless. The only constant is change. For the data quality profession to truly mature, our guiding principles must change with the times, or be relegated to a past that is all too quickly becoming distant.
Share Your Perspectives
In celebration of World Quality Day, please share your perspectives regarding the past, present, and most important, the future of the data quality profession. With apologies to T. H. White, I declare this debate to be about the difference between:
Many enterprise information initiatives are launched in order to unravel that riddle, wrapped in a mystery, inside an enigma, that great unknown, also known as...Customer.
Centuries ago, cartographers used the Latin phrase terra incognita (meaning “unknown land”) to mark regions on a map not yet fully explored. In this century, companies simply can not afford to use the phrase customer incognita to indicate what information about their existing (and prospective) customers they don't currently have or don't properly understand.
What is a Customer?
First things first, what exactly is a customer? Those happy people who give you money? Those angry people who yell at you on the phone or say really mean things about your company on Twitter and Facebook? Why do they have to be so mean?
Mean people suck. However, companies who don't understand their customers also suck. And surely you don't want to be one of thosecompanies, do you? I didn't think so.
Someone who purchases products or services from you. The word “someone” is key because it’s not the role of a “customer” that forms the real problem, but the precision of the term “someone” that causes challenges when we try to link other and more specific roles to that “someone.” These other roles could be contract partner, payer, receiver, user, owner, etc.
Customer is a role assigned to a legal entity in a complete and precise picture of the real world. The role is established when the first purchase is accepted from this real-world entity. Of course, the main challenge is whether or not the company can establish and maintain a complete and precise picture of the real world.
These working definitions were provided by fellow blogger and data quality expert Henrik Liliendahl Sørensen, who recently posted 360° Business Partner View, which further examines the many different ways a real-world entity can be represented, including when, instead of a customer, the real-world entity represents a citizen, patient, member, etc.
A critical first step for your company is to develop your definition of a customer. Don't underestimate either the importance or the difficulty of this process. And don't assume it is simply a matter of semantics.
Some of my consulting clients have indignantly told me: “We don't need to define it, everyone in our company knows exactly what a customer is.” I usually respond: “I have no doubt that everyone in your company uses the word customer, however I will work for free if everyone defines the word customer in exactly the same way.” So far, I haven't had to work for free.
How Many Customers Do You Have?
You have done the due diligence and developed your definition of a customer. Excellent! Nice work. Your next challenge is determining how many customers you have. Hopefully, you are not going to try using any of these techniques:
SELECT COUNT(*) AS "We have this many customers" FROM Customers
SELECT COUNT(DISTINCT Name) AS "No wait, we really have this many customers" FROM Customers
Middle-Square or Blum Blum Shub methods (i.e. random number generation)
Magic 8-Ball says: “Ask again later”
One of the most common and challenging data quality problems is the identification of duplicate records, especially redundant representations of the same customer information within and across systems throughout the enterprise. The need for a solution to this specific problem is one of the primary reasons that companies invest in data quality software and services.
Earlier this year on Data Quality Pro, I published a five part series of articles on identifying duplicate customers, which focused on the methodology for defining your business rules and illustrated some of the common data matching challenges.
Topics covered in the series:
Why a symbiosis of technology and methodology is necessary when approaching this challenge
How performing a preliminary analysis on a representative sample of real data prepares effective examples for discussion
Why using a detailed, interrogative analysis of those examples is imperative for defining your business rules
How both false negatives and false positives illustrate the highly subjective nature of this problem
How to document your business rules for identifying duplicate customers
How to set realistic expectations about application development
How to foster a collaboration of the business and technical teams throughout the entire project
How to consolidate identified duplicates by creating a “best of breed” representative record
To download the associated presentation (no registration required), please follow this link: OCDQ Downloads
Conclusion
“Knowing the characteristics of your customers,” stated Jill Dyché and Evan Levy in the opening chapter of their excellent book, Customer Data Integration: Reaching a Single Version of the Truth, “who they are, where they are, how they interact with your company, and how to support them, can shape every aspect of your company's strategy and operations. In the information age, there are fewer excuses for ignorance.”
For companies of every size and within every industry, customer incognita is a crippling condition that must be replaced with customer cognizance in order for the company to continue to remain competitive in a rapidly changing marketplace.
Do you know your customers? If not, then they likely aren't your customers anymore.
It is a dark and stormy night in the data center. The constant humming of hard drives is mimicking the sound of a hard rain falling in torrents, except at occasional intervals, when it is checked by a violent gust of conditioned air sweeping through the seemingly endless aisles of empty cubicles, rattling along desktops, fiercely agitating the flickering glow from flat panel monitors that are struggling against the darkness.
Tonight, amid this foreboding gloom with only my thoughts for company, I race to complete the production implementation of the Dystopian Automated Transactional Analysis (DATA) system. Nervous, very, very dreadfully nervous I have been, and am, but why will you say that I am mad? Observe how calmly I can tell you the whole story.
Eighteen months ago, I was ordered by executive management to implement the DATA system. The vendor's salesperson was an oddly charming fellow named Machiavelli, who had the eye of a vulture — a pale blue eye, with a film over it. Whenever this eye fell upon me, my blood ran cold.
Machiavelli assured us all that DATA's seamlessly integrated Magic Beans software would migrate and consolidate all of our organization's information, clairvoyantly detecting and correcting our existing data quality problems, and once DATA was implemented into production, Magic Beans would prevent all future data quality problems from happening.
As soon as a source was absorbed into DATA, Magic Beans automatically did us the favor of freeing up disk space by deleting all traces of the source, somehow even including our off-site archives. DATA would then become our only system of record, truly our Single Version of the Truth.
It is impossible to say when doubt first entered my brain, but once conceived, it haunted me day and night. Whenever I thought about it, my blood ran cold — as cold as when that vulture eye was gazing upon me — very gradually, I made up my mind to simply load DATA and rid myself of my doubt forever.
Now this is the point where you will fancy me quite mad. But madmen know nothing. You should have seen how wisely I proceeded — with what caution — with what foresight — with what Zen-like tranquility, I went to work!
I was never happier than I was these past eighteen months while I simply followed the vendor's instructions step by step and loaded DATA! Would a madman have been so wise as this? I think not.
Tomorrow morning, DATA goes live. I can imagine how wonderful that will be. I will be sitting at my desk, grinning wildly, deliriously happy with a job well done. DATA will be loaded, data quality will trouble me no more.
It is now four o'clock in the morning, but still it is as dark as midnight. But as bright as the coming dawn, I can now see three strange men as they gather around my desk.
Apparently, a shriek had been heard from the business analysts and subject matter experts as soon as they started using DATA. Suspicions had been aroused, complaints had been lodged, and they (now identifying themselves as auditors) had been called in by a regulatory agency to investigate.
I smile — for what have I to fear? I welcome these fine gentlemen. I give them a guided tour of DATA using its remarkably intuitive user interface. I urge them audit — audit well. They seemed satisfied. My manner has convinced them. I am singularly at ease. They sit, and while I answer cheerily, they chat away about trivial things. But before long, I feel myself growing pale and wish them gone.
My head aches and I hear a ringing in my ears, but still they sit and chat. The ringing becomes more distinct. I talk more freely, to get rid of the feeling, but it continues and gains volume — until I find that this noise is not within my ears.
No doubt I now grow very pale — but I talk more fluently, and with a heightened voice. Yet the sound increases — and what can I do? It is a low, dull, quick sound. I gasp for breath — and yet the auditors hear it not.
I talk more quickly — more vehemently — but the noise steadily increases. I arise, and argue about trifles, in a high key and with violent gesticulations — but the noise steadily increases. Why will they not be gone? I pace the floor back and forth, with heavy strides, as if excited to fury by the unrelenting observations of the auditors — but the noise steadily increases.
What could I do? I raved — I ranted — I raged! I swung my chair and smashed my computer with it — but the noise rises over all of my attempts to silence it. It grows louder — louder — louder! And still the auditors chat pleasantly, and smile. Is it really possible they can not hear it? Is it really possible they did not notice me smashing my computer?
They hear! — they suspect! — they know! — they are making a mockery of my horror! — this I thought, and this I think. But anything is better than this agony! Anything is more tolerable than this derision! I can not bear their hypocritical smiles any longer! I feel that I must scream or die! — and now — again! — the noise! Louder! Louder!! LOUDER!!!
“DATA!” I finally shriek. “DATA has no quality! NO DATA QUALITY!!! What have I done? What — Have — I — Done?!?”
With a sudden jolt, I awaken at my desk, with my old friend Edgar shaking me by the shoulders.
“Hey, wake up! Executive management wants us in the conference room in five minutes. Apparently, there is a vendor here today pitching a new system called DATA using software called Magic Beans...”
In 1970, the United States Department of Labor created the Occupational Safety and Health Administration (OSHA). The mission of OSHA is to prevent work-related injuries, illnesses, and deaths. Based on statistics from 2007, since OSHA's inception, occupational deaths in the United States have been cut by 62% and workplace injuries have declined by 42%.
OSHA regularly conducts inspections to determine if organizations are in compliance with safety standards and assesses financial penalties for violations. In order to both promote workplace safety and avoid penalties, organizations provide their employees with training on the appropriate precautions and procedures to follow in the event of an accident or an emergency.
Training programs certify new employees in safety protocols and indoctrinate them into the culture of a safety-conscious workplace. By requiring periodic re-certification, all employees maintain awareness of their personal responsibility in both avoiding workplace accidents and responding appropriately to emergencies.
Although there has been some debate about the effectiveness of the regulations and the enforcement policies, over the years OSHA has unquestionably brought about many necessary changes, especially in the area of industrial work site safety where dangerous machinery and hazardous materials are quite common.
Obviously, even with well-defined safety standards in place, workplace accidents will still occasionally occur. However, these standards have helped greatly reduce both the frequency and severity of the accidents. And most importantly, safety has become a natural part of the organization's daily work routine.
A Culture of Data Quality
Similar to indoctrinating employees into the culture of a safety-conscious workplace, more and more organizations are realizing the importance of creating and maintaining the culture of a data quality conscious workplace. A culture of data quality is essential for effective enterprise information management.
Waiting until a serious data quality issue negatively impacts the organization before starting an enterprise data quality program is analogous to waiting until a serious workplace accident occurs before starting a safety program.
Many data quality issues are caused by a lack of data ownership and an absence of clear guidelines indicating who is responsible for ensuring that data is of sufficient quality to meet the daily business needs of the enterprise. In order for data quality to be taken seriously within your organization, everyone first needs to know that data quality is an enterprise-wide priority.
Additionally, data quality standards must be well-defined, and everyone must accept their personal responsibility in both preventing data quality issues and responding appropriately to mitigate the associated business risks when issues do occur.
Data Quality Assessments
The data equivalent of a safety inspection is a data quality assessment, which provides a much needed reality check for the perceptions and assumptions that the enterprise has about the quality of its data.
Performing a data quality assessment helps with a wide variety of tasks including: verifying data matches the metadata that describes it, preparing meaningful questions for subject matter experts, understanding how data is being used, quantifying the business impacts of poor quality data, and evaluating the ROI of data quality improvements.
An initial assessment provides a baseline and helps establish data quality standards as well as set realistic goals for improvement. Subsequent data quality assessments, which should be performed on a regular basis, will track your overall progress.
Although preventing data quality issues is your ultimate goal, don't let the pursuit of perfection undermine your efforts. Always be mindful of the data quality issues that remain unresolved, but let them serve as motivation. Learn from your mistakes without focusing on your failures – focus instead on making steady progress toward improving your data quality.
Data Governance
The data equivalent of verifying compliance with safety standards is data governance, which establishes policies and procedures to align people throughout the organization. Enterprise data quality programs require a data governance framework in order successfully deploy data quality as an enterprise-wide initiative.
By facilitating the collaboration of all business and technical stakeholders, aligning data usage with business metrics, enforcing data ownership, and prioritizing data quality, data governance enables effective enterprise information management.
Obviously, even with well-defined and well-managed data governance policies and procedures in place, data quality issues will still occasionally occur. However, your goal is to greatly reduce both the frequency and severity of your data quality issues.
And most importantly, the responsibility for ensuring that data is of sufficient quality to meet your daily business needs, has now become a natural part of your organization's daily work routine.
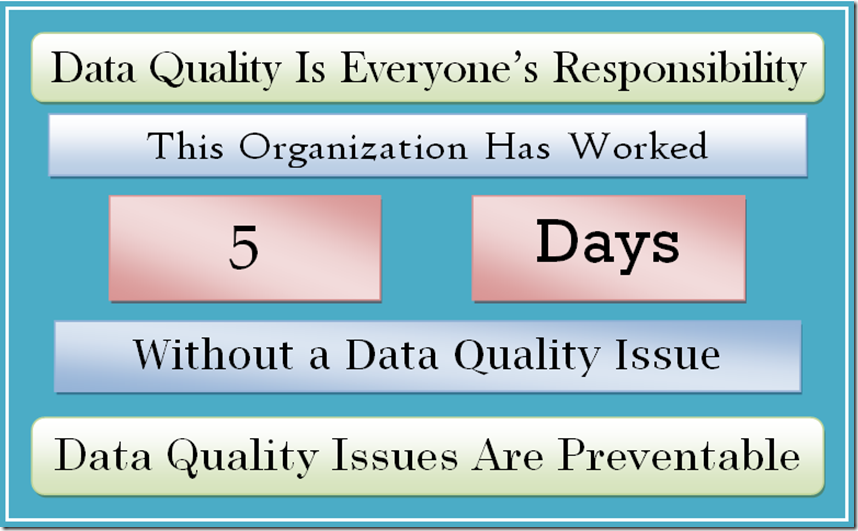
Days Without A Data Quality Issue
Organizations commonly display a sign indicating how long they have gone without a workplace accident. Proving that I certainly did not miss my calling as a graphic designer, I created this “sign” for Days Without A Data Quality Issue:
From Vality Technology, through Ascential Software, and eventually with IBM, I have spent most of my career working with the data quality tool that is now known as IBM InfoSphere QualityStage.
Throughout my time in Research and Development (as a Senior Software Engineer and a Development Engineer) and Professional Services (as a Principal Consultant and a Senior Technical Instructor), I was often asked to wear many hats for QualityStage – and not just because my balding head is distractingly shiny.
True champions are championship teams. The QualityStage team (past and present) is the most remarkable group of individuals that I have ever had the great privilege to know, let alone the good fortune to work with. Thank you all very, very much.
The IBM Information Champion Program
Previously known as the Data Champion Program, the IBM Information Champion Program honors individuals making outstanding contributions to the Information Management community.
Technical communities, websites, books, conference speakers, and blogs all contribute to the success of IBM’s Information Management products. But these activities don’t run themselves.
Behind the scenes, there are dedicated and loyal individuals who put in their own time to run user groups, manage community websites, speak at conferences, post to forums, and write blogs. Their time is uncompensated by IBM.
IBM honors the commitment of these individuals with a special designation — Information Champion — as a way of showing their appreciation for the time and energy these exceptional community members expend.
Information Champions are objective experts. They have no official obligation to IBM.
They simply share their opinions and years of experience with others in the field, and their work contributes greatly to the overall success of IBM Information Management.
We are the Champions
The IBM Information Champion Program has been expanded from the Data Management segment to all segments in Information Management, and now includes IBM Cognos, Enterprise Content Management, and InfoSphere.
Today is Friday, which for Twitter users like me, can mean only one thing...
Every Friday, Twitter users recommend other users that you should follow. FollowFriday has kind of become the Twitter version of peer pressure – in other words, I recommended you, why didn't you recommend me?
Among my fellow Twitter addicts, it has come to be viewed either as a beloved tradition of social media community building, or a hated annoyance. It is almost as deeply polarizing as Pepsi vs. Coke or Soccer vs. Football (by the way, just for the official record, I love FollowFriday and I am firmly in the Pepsi and Football camps – and by Football, I mean American Football).
In this blog post, I want to provide you with some examples of what I do on FollowFriday, and how I manage to actually follow (or do I?) so many people (586 and counting).
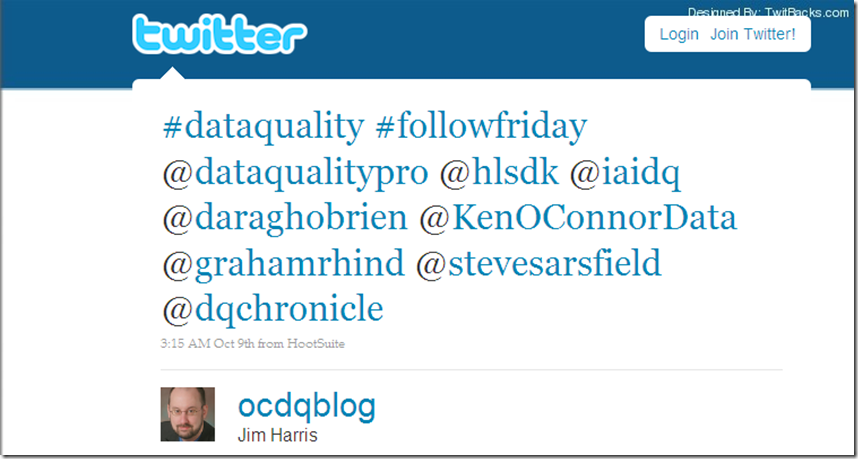
FollowFriday Example # 1 – The List
Perhaps the most common example of a FollowFriday tweet is to simply list as many users as you can within the 140 characters:
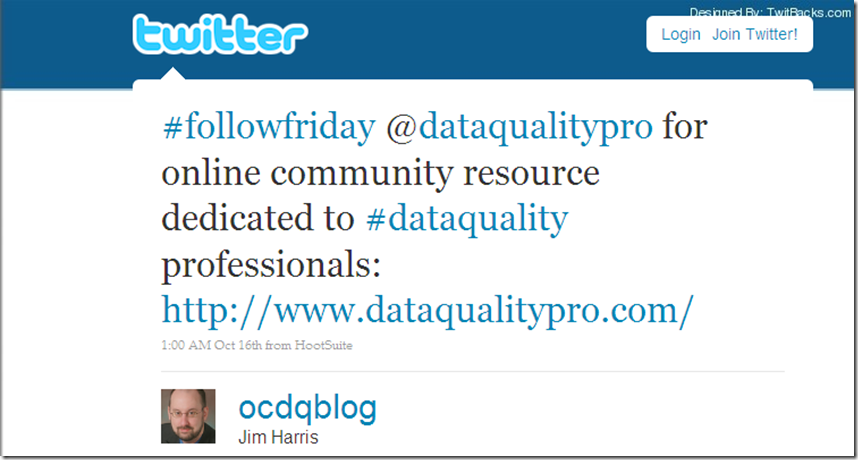
FollowFriday Example # 2 – The Tweet-Out
An alternative FollowFriday tweet is to send a detailed Tweet-Out (the Twitter version of a Shout-Out) to a single user:
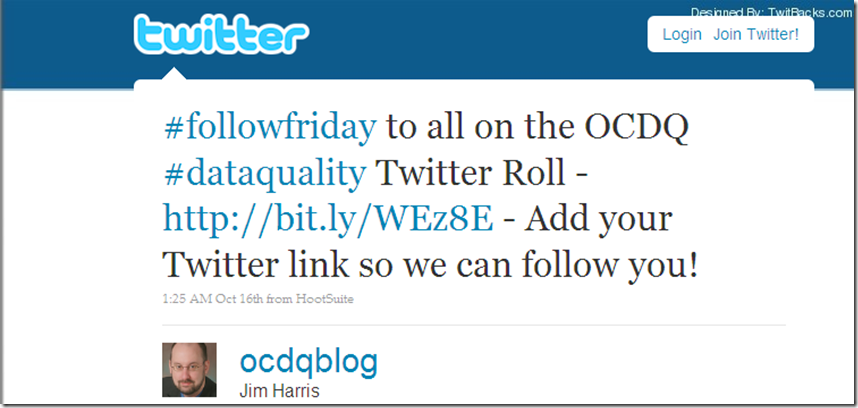
FollowFriday Example # 3 – The Twitter Roll
Yet another alternative FollowFriday tweet is to send a link to a Twitter Roll (the Twitter version of a Blog Roll):
To add your Twitter link so we can follow you, please click here: OCDQ Twitter Roll
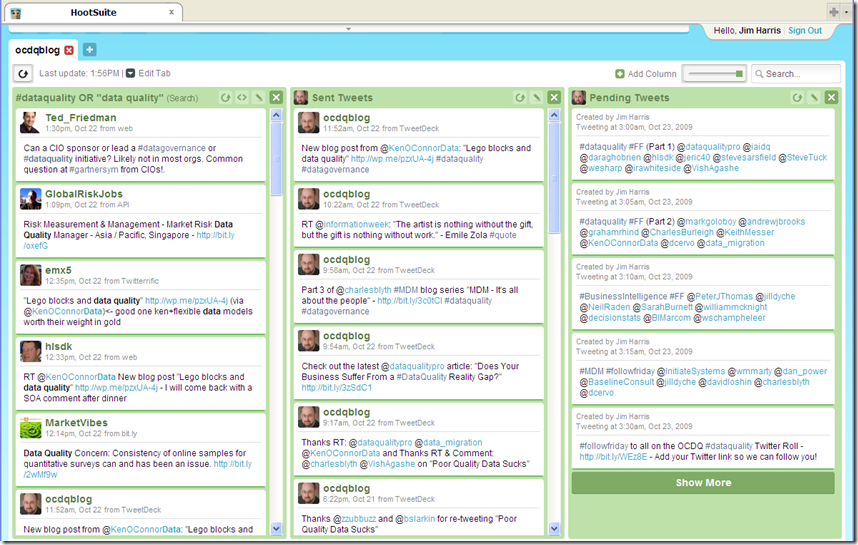
Give a Hoot, Use HootSuite
Most of my FollowFriday tweets are actually scheduled. In part, I do this because I follow people from all around the world and by the time I finally crawl out of bed on Friday, many of my tweeps have already started their weekend. And let's face it, the other reason that I schedule my FollowFriday tweets has a lot to do with why obsessive-compulsive is in the name of my blog.
Please note that the limitation of 140 characters has necessitated the abbreviation #FF instead of the #followfriday “standard.”
The Tweet-rix
Unless you only follow a few people, it is a tremendous challenge to actually follow every user you follow. To be perfectly honest, I do not follow everyone I follow – no, I wasn't just channeling Yogi Berra (I am a Boston Red Sox fan!). To borrow an analogy from Phil Simon, trying to watch your entire Twitter stream (i.e. The Tweet-rix) is like being an operator on The Matrix.
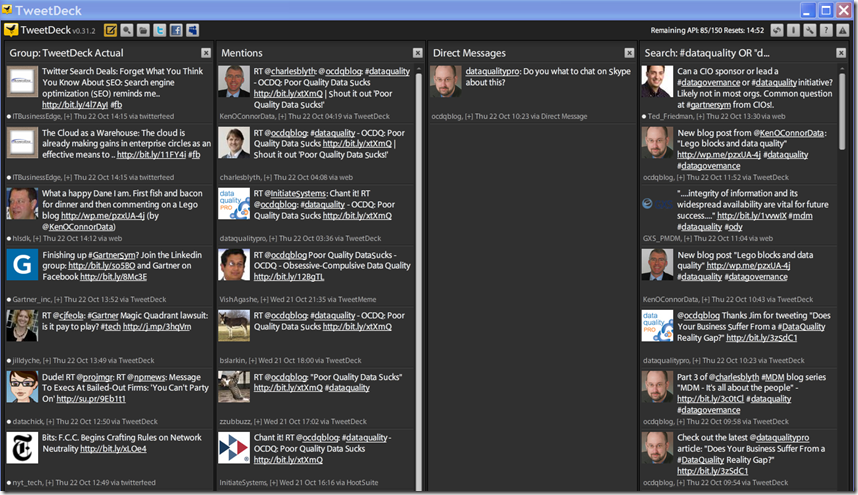
Not that I am all about me, but I do pay the most attention to Mentions and Direct Messages. Next, since I am primarily interested in data quality, I use an embedded search to follow any tweets that use the #dataquality hashtag or mention the phrase “data quality.” TweetDeck is one of many clients allowing you to create Groups of users to help organize The Tweet-rix.
To further prove my Sci-Fi geek status, I created a group called TweetDeck Actual, which is an homage to BattleStar Galactica, where saying “This is Galactica Actual” confirms an open communications channel has been established with the Galactica.
I rotate the users I follow in and out of TweetDeck Actual on a regular basis in order to provide for a narrowly focused variety of trenchant tweets. (By the way, I learned the word trenchant from a Jill Dyché tweet).
The Search for Tweets
You do not need to actually have a Twitter account in order to follow tweets. There are several search engines designed specifically for Twitter. And according to recent rumors, tweets will be coming soon to a Google near you.
Here are a just a few ways to search Twitter for data quality content:
With apologies to fellow fans of U2 (one of my all-time favorite bands):
If you tweet away, tweet away I tweet away, tweet away I will follow If you tweet away, tweet away I tweet away, tweet away I will follow I will follow
For those readers who are not baseball fans, the Los Angeles Angels of Anaheim swept the Red Sox out of the playoffs. I will let Miller's words describe their demise: “Down two to none in the best of five series, the Red Sox took a 6-4 lead into the ninth inning, turning control over to impenetrable closer Jonathan Papelbon, who hadn't allowed a run in 26 postseason innings. The Angels, within one strike of defeat on three occasions, somehow managed a miracle rally, scoring 3 runs to take the lead 7-6, then holding off the Red Sox in the bottom of the ninth for the victory to complete the shocking sweep.”
Baseball and Data Quality
What, you may be asking, does baseball have to do with data quality? Beyond simply being two of my all-time favorite topics, quite a lot actually. Baseball data is mostly transaction data describing the statistical events of games played.
Statistical analysis has been a beloved pastime even longer than baseball has been America's Pastime. Number-crunching is far more than just a quantitative exercise in counting. The qualitative component of statistics – discerning what the numbers mean, analyzing them to discover predictive patterns and trends – is the very basis of data-driven decision making.
“The Red Sox,” as Miller explained, “are certainly exemplars of the data and analytic team-building methodology” chronicled in Moneyball: The Art of Winning an Unfair Game, the 2003 book by Michael Lewis. Red Sox General Manager Theo Epstein has always been an advocate of the so-called evidenced-based baseball, or baseball analytics, pioneered by Bill James, the baseball writer, historian, statistician, current Red Sox consultant, and founder of Sabermetrics.
In another book that Miller and I both highly recommend, Super Crunchers, author Ian Ayres explained that “Bill James challenged the notion that baseball experts could judge talent simply by watching a player. James's simple but powerful thesis was that data-based analysis in baseball was superior to observational expertise. James's number-crunching approach was particular anathema to scouts.”
“James was baseball's herald,” continues Ayres, “of data-driven decision making.”
The Drunkard's Walk
As Mlodinow explains in the prologue: “The title The Drunkard's Walk comes from a mathematical term describing random motion, such as the paths molecules follow as they fly through space, incessantly bumping, and being bumped by, their sister molecules. The surprise is that the tools used to understand the drunkard's walk can also be employed to help understand the events of everyday life.”
Later in the book, Mlodinow describes the hidden effects of randomness by discussing how to build a mathematical model for the probability that a baseball player will hit a home run: “The result of any particular at bat depends on the player's ability, of course. But it also depends on the interplay of many other factors: his health, the wind, the sun or the stadium lights, the quality of the pitches he receives, the game situation, whether he correctly guesses how the pitcher will throw, whether his hand-eye coordination works just perfectly as he takes his swing, whether that brunette he met at the bar kept him up too late, or the chili-cheese dog with garlic fries he had for breakfast soured his stomach.”
“If not for all the unpredictable factors,” continues Mlodinow, “a player would either hit a home run on every at bat or fail to do so. Instead, for each at bat all you can say is that he has a certain probability of hitting a home run and a certain probability of failing to hit one. Over the hundreds of at bats he has each year, those random factors usually average out and result in some typical home run production that increases as the player becomes more skillful and then eventually decreases owing to the same process that etches wrinkles in his handsome face. But sometimes the random factors don't average out. How often does that happen, and how large is the aberration?”
Conclusion
I have heard some (not Mlodinow or anyone else mentioned in this post) argue that data quality is an irrelevant issue. The basis of their argument is that poor quality data are simply random factors that, in any data set of statistically significant size, will usually average out and therefore have a negligible effect on any data-based decisions.
However, the random factors don't always average out. It is important to not only measure exactly how often poor quality data occur, but acknowledge the large aberration poor quality data are, especially in data-driven decision making.
As every citizen of Red Sox Nation is taught from birth, the only acceptable opinion of our American League East Division rivals, the New York Yankees, is encapsulated in the chant heard throughout the baseball season (and not just at Fenway Park):
“Yankees Suck!”
From their inception, the day-to-day business decisions of every organization are based on its data. This decision-critical information drives the operational, tactical, and strategic initiatives essential to the enterprise's mission to survive and thrive in today's highly competitive and rapidly evolving marketplace.
It doesn't quite roll off the tongue as easily, but a chant heard throughout these enterprise information initiatives is: