Adventures in Data Profiling (Part 7)
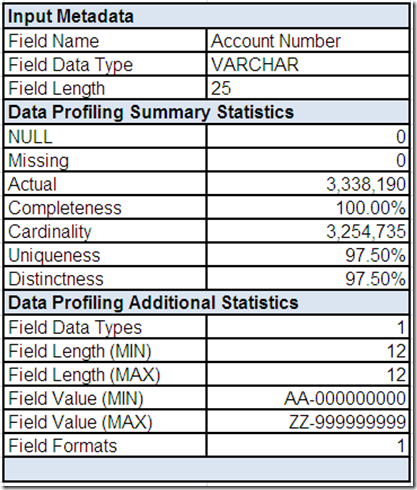
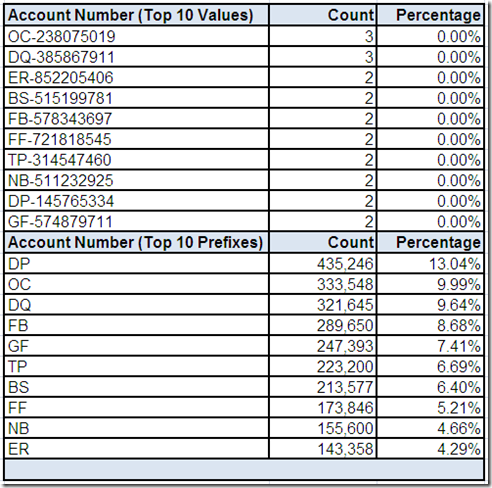
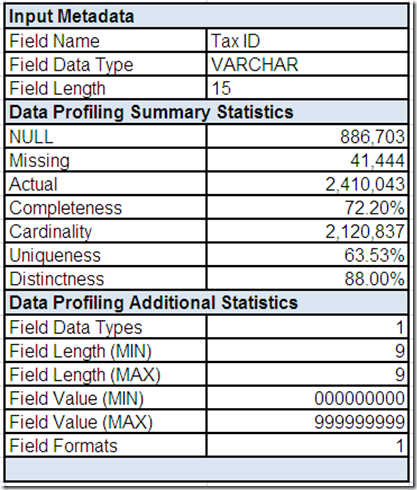
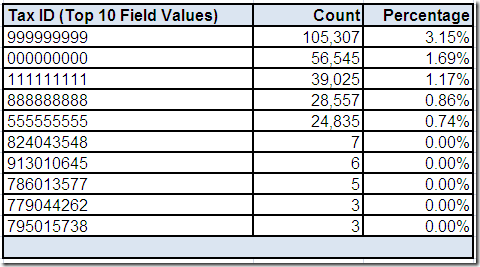
/In Part 6 of this series: You completed your initial analysis of the Account Number and Tax ID fields.
Previously during your adventures in data profiling, you have looked at customer name within the context of other fields. In Part 2, you looked at the associated customer names during drill-down analysis on the Gender Code field while attempting to verify abbreviations as well as assess NULL and numeric values. In Part 6, you investigated customer names during drill-down analysis for the Account Number and Tax ID fields while assessing the possibility of duplicate records.
In Part 7 of this award-eligible series, you will complete your initial analysis of this data source with direct investigation of the Customer Name 1 and Customer Name 2 fields.
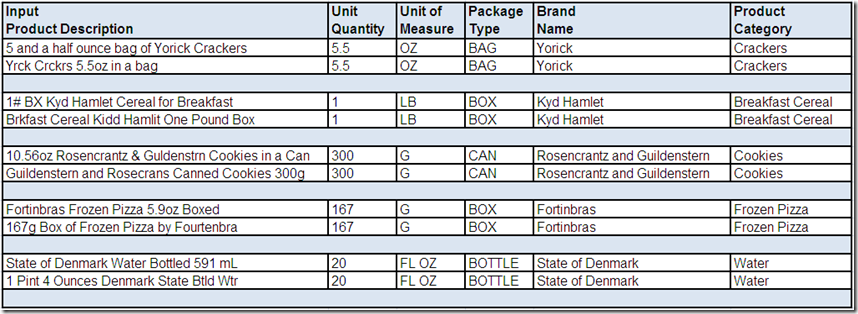
Previously, the data profiling tool provided you with the following statistical summaries for customer names:

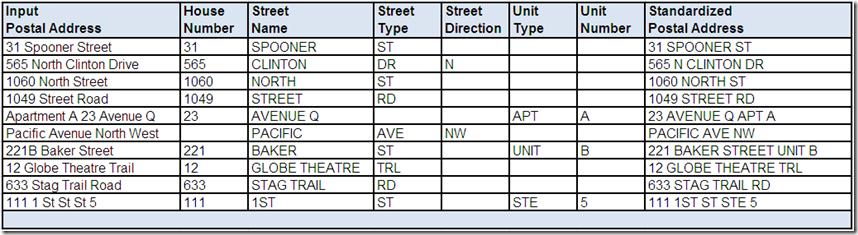
As we discussed when we looked at the E-mail Address field (in Part 3) and the Postal Address Line fields (in Part 5), most data profiling tools will provide the capability to analyze fields using formats that are constructed by parsing and classifying the individual values within the field.
Customer Name 1 and Customer Name 2 are additional examples of the necessity of this analysis technique. Not only are the cardinality of these fields very high, but they also have a very high Distinctness (i.e. the exact same field value rarely occurs on more than one record).
Customer Name 1
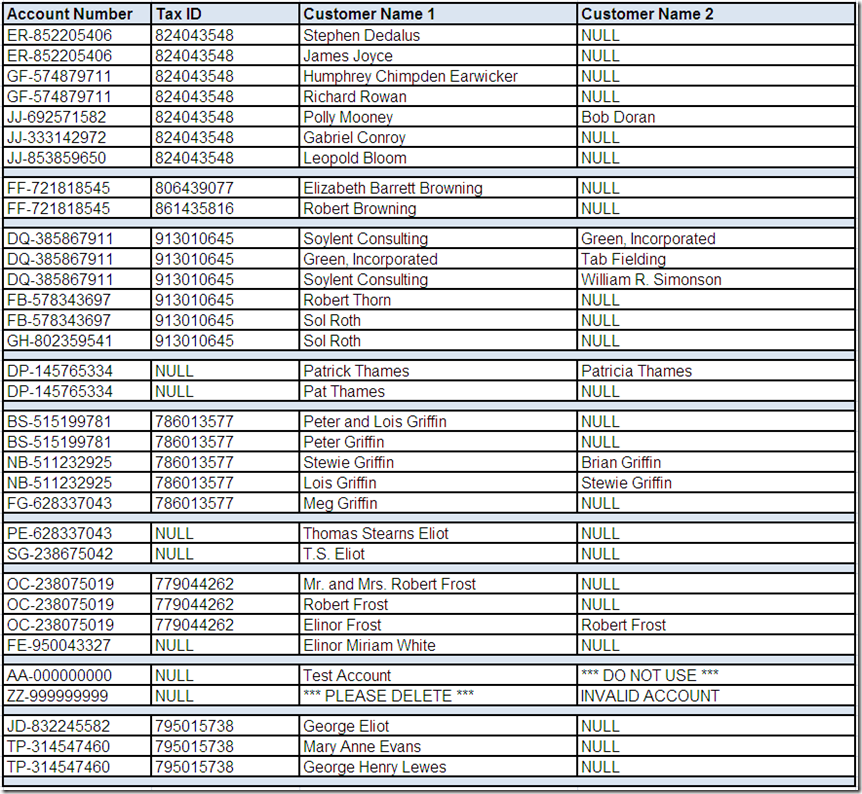
The data profiling tool has provided you the following drill-down “screen” for Customer Name 1:
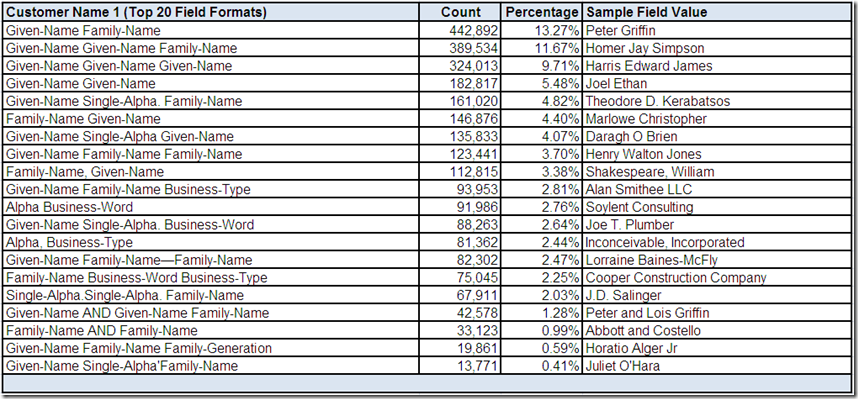
Please Note: The differentiation between given and family names has been based on our fictional data profiling tool using probability-driven non-contextual classification of the individual field values.
For example, Harris, Edward, and James are three of the most common names in the English language, and although they can also be family names, they are more frequently given names. Therefore, “Harris Edward James” is assigned “Given-Name Given-Name Given-Name” for a field format. For this particular example, how do we determine the family name?
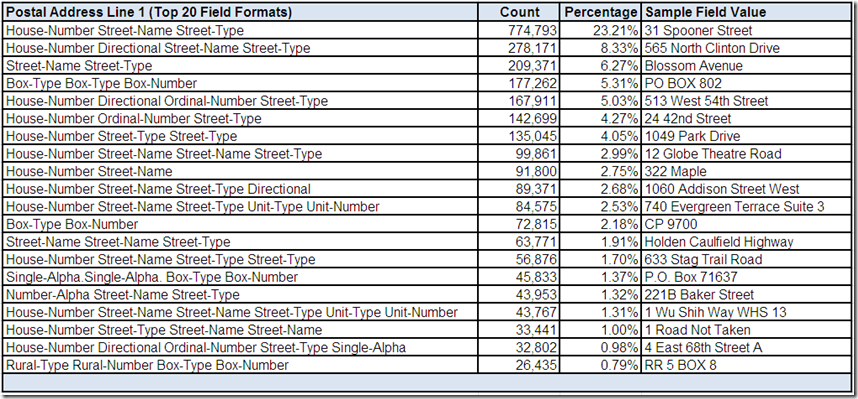
The top twenty most frequently occurring field formats for Customer Name 1 collectively account for over 80% of the records with an actual value in this field for this data source. All of these field formats appear to be common potentially valid structures. Obviously, more than one sample field value would need to be reviewed using more drill-down analysis.
What conclusions, assumptions, and questions do you have about the Customer Name 1 field?
Customer Name 2
The data profiling tool has provided you the following drill-down “screen” for Customer Name 2:
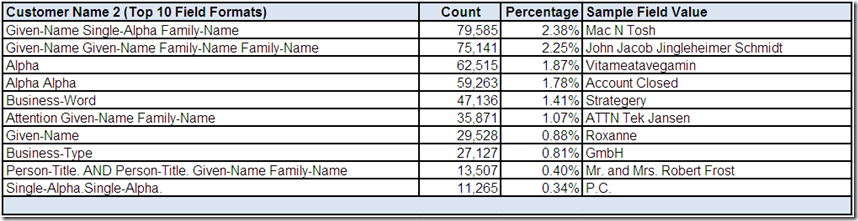
The top ten most frequently occurring field formats for Customer Name 2 collectively account for over 50% of the records with an actual value in this sparsely populated field for this data source. Some of these field formats show common potentially valid structures. Again, more than one sample field value would need to be reviewed using more drill-down analysis.
What conclusions, assumptions, and questions do you have about the Customer Name 2 field?
The Challenges of Person Names
Not that business names don't have their own challenges, but person names present special challenges. Many data quality initiatives include the business requirement to parse, identify, verify, and format a “valid” person name. However, unlike postal addresses where country-specific postal databases exist to support validation, no such “standards” exist for person names.
In his excellent book Viral Data in SOA: An Enterprise Pandemic, Neal A. Fishman explains that “a person's name is a concept that is both ubiquitous and subject to regional variations. For example, the cultural aspects of an individual's name can vary. In lieu of last name, some cultures specify a clan name. Others specify a paternal name followed by a maternal name, or a maternal name followed by a paternal name; other cultures use a tribal name, and so on. Variances can be numerous.”
“In addition,” continues Fishman, “a name can be used in multiple contexts, which might affect what parts should or could be communicated. An organization reporting an employee's tax contributions might report the name by using the family name and just the first letter (or initial) of the first name (in that sequence). The same organization mailing a solicitation might choose to use just a title and a family name.”
However, it is not a simple task to identify what part of a person's name is the family name or the first given name (as some of the above data profiling sample field values illustrate). Again, regional, cultural, and linguistic variations can greatly complicate what at first may appear to be a straightforward business request (e.g. formatting a person name for a mailing label).
As Fishman cautions, “many regions have cultural name profiles bearing distinguishing features for words, sequences, word frequencies, abbreviations, titles, prefixes, suffixes, spelling variants, gender associations, and indications of life events.”
If you know of any useful resources for dealing with the challenges of person names, then please share them by posting a comment below. Additionally, please share your thoughts and experiences regarding the challenges (as well as useful resources) associated with business names.
What other analysis do you think should be performed for customer names?
In Part 8 of this series: We will conclude the adventures in data profiling with a summary of the lessons learned.
Related Posts
Adventures in Data Profiling (Part 1)
Adventures in Data Profiling (Part 2)
Adventures in Data Profiling (Part 3)
Adventures in Data Profiling (Part 4)
Adventures in Data Profiling (Part 5)
Adventures in Data Profiling (Part 6)